

MAP WORK
Map – representation of the whole or part of the earth’s surface drawn to scale.
- Shows outline of objects on the ground.
- Drawn as if the drawer was above the ground.
- It shows details.
- Most of the features are indicated by symbols.
Picture: image of a real object.
- Gives details in their visible shapes and sizes.
- Can be in the form of freehand drawing, painting, or a photograph.
- Not drawn to scale.
Plan: outline of something drawn to scale.
- Also drawn as if a person was directly above the ground.
- It represents a very small place.
- The scale is large to show details, e.g., house plan.
- Gives specific information.
Types of Maps
Classified according to the purpose for which each map is drawn.
Topographical Maps: These show selected natural physical features on a small portion of a country.
Atlas maps: this is a collection of maps in one volume.
Sketch maps: maps which are roughly drawn. A good sketch map should have the following characteristics:
- Neat and clear.
- Title.
- Frame.
- Key.
- Compass direction.
Uses of Maps
- Sketch maps are used to summarize information for easy reference.
- Used for locating other countries.
- Used for comparing sizes of countries.
- For locating climatic regions of different parts of the world.
- Give information on distribution of geographical phenomena, e.g., vegetation on the earth’s surface.
- Help travelers to find their way.
- Used to calculate distance of a certain place.
- Used to locate physical features like landforms.
Marginal Information
Information contained in the area surrounding the map.
- Map name, e.g., Yimbo.
- Sheet title, e.g., East Africa 1:50000 (Kenya).
- Grid system numbers.
- Latitudes and longitudes.
- Compass direction with grid, true and magnetic north.
- Scales.
- Key.
- Publisher and copyright.
- Map identification:
- Map series.
- Sheet number or sheet index.
Map Scales
A scale is a ratio of a distance on a map to a corresponding distance on the ground.
Types of Scales
Statement scale – expressed in words, e.g., 1cm represents 1km, 1cm to 1km.
Representative Fraction (RF) – expressed as a fraction or ratio, e.g., 1/200,000 or 1:200,000.
Linear scale – shown by a line which is subdivided into smaller units.
Conversion of Scales
Statement scale into RF
1cm represents 1km to RF
Multiply the number of kilometres by 100,000 (1km = 100,000cm), i.e., 1 × 100,000 = 100,000.
Statement scale is 1/100,000 or 1:100,000.
2cm represents 1km
Divide both sides by two to get 1cm represents ½ kilometre.
Multiply ½ by 100,000 to get 50,000.
RF is 1/50,000 or 1:50,000.
RF to Statement Scale
Divide the denominator by 100,000.
Write the scale in statement form.
Linear Scale to Statement Scale
- Measure a unit distance off a linear scale, e.g.,

- The distance is 4 – 3 = 1km which is represented by 2cm.
- Use the methods in (1) and (2) above.
Q. Given that the ground distance is 200km while the distance on map is 20cm, calculate the scale.
Sizes of Scales
- Small scales – show a large area of land on a small size of paper. They show limited details, e.g., 1:250,000, 1:500,000, 1:1,000,000.
- Medium scales – used to represent a relatively smaller area on a given size of paper, e.g., 1:50,000, 1:100,000, 1:125,000.
- Large scales – used to represent a small area of land on a given piece of paper. They show a lot of details, e.g., 1:2,500, 1:10,000, 1:25,000.
Arranging Scales in Order
Ascending Order – smallest to largest
Descending Order – largest to smallest
(1) 1/500,000
(3) 1:25,000
(4) 1/10,000
(2) 1cm represents 500m
Uses of Scales
- Estimating distances on maps.
- Measuring distances accurately – use dividers and ruler, piece of string or thread for curved distances, or straight edge of paper.
Example: calculate actual distance of a line 8.5cm long on a map using the following scales.
(i) 2cm represents 1km
(ii) 1:100,000
- Calculation of areas – number of full grid squares + number of ½ grid squares / 2 or use of rectangles (l × b) or triangles (½ b × h).
Direction
Course upon which something is pointing to.
Methods of Showing Direction
Traditional Methods
1. Use of Stars
– E.g., use of groups of stars called plough to find northern direction by locating the pole star and use of Southern Cross by using the brightest star which is over South Pole to find northern direction.
2. Use of Shadows

– E.g., morning, shadow of flag pole cast to your left you are facing north, etc.
3. Land Marks
Using conspicuous features such as hills, buildings, even roads to get direction.
Modern Methods
- Land Marks
- Compass Direction
Use of magnetic compass which has a needle that always points north.
It has 16 cardinal points and 4 are basic.
Bearing
Expression of direction in degrees of an angle.
It’s measured from north in a clockwise direction.
Calculation of Bearing
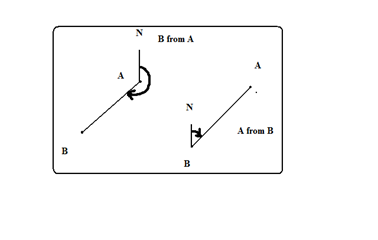
Draw N-S line through observation point.
Join the two points. If it’s a feature, the line should end at the centre of that feature.
Using a protractor measure the angle between the N-S line and the line joining the two points in a clockwise direction.
Bearing is expressed in degrees, minutes, and seconds. 1° = 60′ (min), 1 min = 60″ (sec).
The degrees are always expressed in 3 figures, e.g., 030°.
Types of Norths

1. True North
Position on the globe where all longitudes meet or the direction of North Pole.
2. Grid North
Point where Eastings meet at the North Pole.
3. Magnetic North
Point where the magnetic needle rests when left to swing freely.
Types of Bearing
1. Grid Bearing
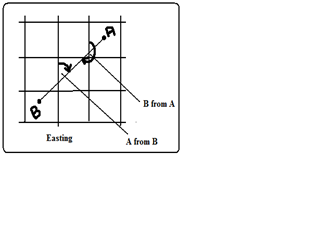
Bearing calculated from Grid North.
- Join the two points on the topographical map using a line.
- Measure the angle where the Eastings intersect the line joining the two points, e.g., 030°.
2. True Bearing
Bearing calculated from True North. It is calculated when the type of bearing isn’t specified.
E.g., from our compass diagram true bearing will be 30° – 1′ = 29°59′.
3. Magnetic Bearing
Bearing calculated from Magnetic North.
Position of Magnetic North changes slightly every year.
Steps
- Years which have elapsed × Annual change. (No need if annual change is negligible). E.g., from our compass diagram annual change = (2009 – 1991) × 4.8′ = 18 × 4.8′ = 86.4′ = 1°26.4′.
- Add to the angle between the grid and magnetic bearing, i.e., 1°26.4′ + 2°30′ = 3°56.4′.
- Add to the Grid bearing (if change is towards E) or subtract (if change is towards W). 30° + 3°56.4′ = 33°56.4′.
Location of Places
Showing the position of a place or feature on a topographical map.
Methods
Use of Place Names
Locating a feature by using the name of the place it’s at, e.g., a river in Kisumu, Nakuru, etc. Or if it isn’t at a named place, locate by the nearest named place, e.g., a meander near Garissa town.
Use of Direction, Bearing, and Distance
This is from a stated position, e.g., Locate Nakuru from Nairobi.
Nakuru is 157km N.W of Nairobi.
Latitudes and Longitudes
The main longitudes are I.D.L and Greenwich / Prime Meridian.
The main lines of latitudes:
- The equator / Great Circle (0°), which is the longest.
- Tropic of Cancer (23½°N) of equator.
- Tropic of Capricorn (23½°S) south of equator.
- The Arctic Circle (66½°N).
- Antarctic Circle (66½°S).
They are marked at the margins. Latitude is stated first (N or S) and longitude later (E or W), e.g., X°N Y°E.
- Identify a place.
- Identify the nearest numbered latitude and longitude.
- Estimate to the nearest 1°.
Grid Reference
Grid lines: network of lines on topographical maps.
Numbered in small and large numbers, and the large ones are used.
Eastings: N-S grid lines called so because they are numbered eastwards.
Northings: W-E grid lines called so because they are numbered northwards.
Grid reference is given in 4 figures or six figures. In 4 figure, the nearest grid line is stated while the 6 figure is estimated in fractions by dividing the space between grid lines into 10 equal parts.
Easting is stated first followed by northing.
In the example below the 4 figure grid references are:
- A – 6856
- B – 6856
- C – 6857
6 figure grid references are:
- A – 675555
- B – 680560
- C – 682568

Methods of Representing Relief on Topographical Maps
Relief is the nature of landscape, e.g., plain, plateau, valleys, hills, etc.
Spot Heights
Points on map whose positions and heights have been determined by surveyors. They are shown by a dot and a figure, e.g., (.1827).
- Advantage – show actual heights.
- Disadvantage – can’t be used to identify landforms.
Trigonometrical Stations/Points

Carefully chosen points and their altitude determined which are used as a basis for surveying an area.
They are marked on the ground by concrete pillar or slab.
They are indicated on topographical maps by:
Isohypes/Contours and Form Lines
A contour is a line on a map joining all points of the same height above sea level. They are brown in colour and have heights written on them.
Form lines are lines drawn on a map joining places of approximately the same height above sea level. They are less brown than contours and not all have values written on them.
Both contours and form lines are referred to as contours.
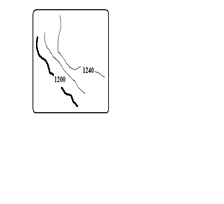
Contour/Vertical interval is the difference in height between any two successive contours.
Advantages of contours:
- They show actual heights.
- Can be used to identify landforms.
Pictorials
Showing relief by drawing landforms at approximate positions where they are found, e.g., mountains, hills, valleys, etc.
Disadvantages:
- They obscure details behind them.
- Don’t give height above sea level.
- Limited variety of landforms can be accommodated.
Hachures
Short lines drawn to represent direction of slope.
- On steep land they are thick and close together.
- On gentle slopes they are thin and wide apart.
Their disadvantage is that they can’t be drawn on flat land.
Hill Shading
Showing relief by shading to show shadows whereby steepest slopes which are least lit have darker shade while hilltops, surfaces of plateaus and plains, and valley bottoms which are well lit have lighter shade.
Layer Tinting
Colouring or shading land within a certain range of altitude or using a single colour with varying tones where the colour gets darker with increasing altitude.


2 Comments