

BUSINESS STUDIES NOTES
FORM THREE
DEMAND AND SUPPLY
Meaning of demand
Demand is the quantity of a product that buyers are willing and able to buy at a given price over a given period of time.
Factors that determine the demand for a product (determinants of demand)
- The price of a product: if the price is low, more will be demanded; if high, less will be demanded.
- The buyer’s income: the higher the people’s income, the higher the demand for goods and services, and vice versa.
- Government policy: if the government imposes high taxes on a commodity, it becomes expensive and less of it is demanded. The effects of a subsidy are to lower the price of the product, leading to an increase in its demand. The government may also influence the demand of a product by enacting laws that either limit or promote the consumption of a product.
- The population: with many people available, more goods are demanded; if the population is small, less is bought from the market.
- Tastes, fashions and preferences: if people have a preference for a product, they will demand more of it. If their preferences change to another product, they will reduce the demand for the product they were using before.
- The distribution of incomes: where income is well distributed, the demand for goods and services is high, as opposed to when the income is in the hands of a few people.
- Future expectations of price changes: if prices are expected to go up in the future, more goods will be demanded in the present; if prices are expected to go down, fewer goods will be demanded in the present.
- The weather: certain goods are demanded more during certain weather conditions, e.g., heavy clothes during cold seasons or umbrellas during rainy seasons.
- Price of related products: for goods that are complements of one another, e.g., pen and ink, a fall in the price of one leads to an increase in the demand for the other. In the case of goods that are substitutes of one another, e.g., soda and fruit juice, an increase in the price of one leads to an increase in the demand for the other.
- The terms of sale: the better the terms of sale, for example, provision of credit or better discounts, the higher the demand for a given product.
Types of demand
Derived demand: a product is said to have derived demand when it is demanded to help in the production of other goods and services; for example, the demand for building materials arising from the demand for houses.
Joint demand: items are said to have joint demand if the use of one requires the use of another. The goods are complementarily used together, like pen and ink.
Demand schedule and demand curve
Demand schedule
A demand schedule is a table showing the quantities of a commodity that consumers are willing and able to buy at different prices within a given period of time. A demand schedule can be prepared for an individual or for the entire market.
Demand curve
A demand curve is the graph showing the quantities demanded against the prices. On the y-axis is recorded price and on the x-axis the quantities demanded.
Draw a demand curve given the following demand schedule
| Price of the product in shs | Quantity of the goods demanded in kg |
|---|---|
10 20 30 40 50 60 70 80 | 40 35 30 25 20 15 10 5 |
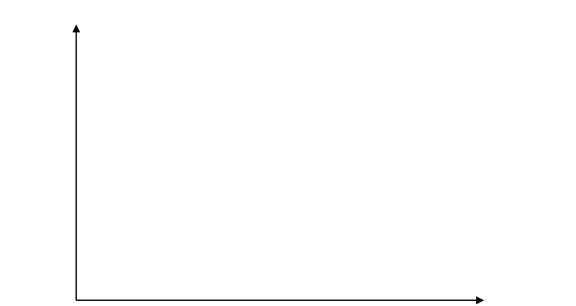
The graph shows that the demand curve (DD) slopes from the left to the right, indicating that as prices go down, the quantity demanded increases and vice versa.
This tendency of demand to increase as price decreases and to reduce as the price increases is referred to as the law of demand. Therefore, a normal demand curve slopes from left to right.
Movement along a demand curve and a shift in demand curve
Movement along the demand curve
A movement along a demand curve refers to changes in quantity of a product demanded as a result of change in its price only. As the price of the product increases, the quantity demanded decreases. It leads to a movement from one point to another on the same demand curve as shown below:
 (ii)
(ii)
 (ii)
(ii)
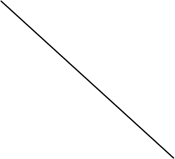
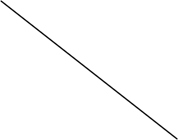


- In a movement along the demand curve, no new demand curve is created. If price increases from P0 to P1 in the diagram above, quantity demanded will fall from Q1 to Q2, i.e., movement from a to b.
- If price falls from P2 to P3, the quantity demanded increases from Q2 to Q3, i.e., movement from a to c.
Shift of the demand curve
This is when the demand curve moves either to the right or left. It occurs as a result of changes in factors influencing demand other than the price of the product concerned. This can be illustrated as below:
In (i) at price OP the quantity demanded is OQ. After the demand curve shifts from D0D0 to DD, a different quantity OQ1 is demanded although the price remains at OP. Thus points L and M are on different demand curves.
Similarly, when the demand curve shifts from D1D1 to D2D2 as in (ii), a different quantity OQ3 is demanded at the same price OP2 as before. Thus the two points R and S are on two different demand curves.
A shift of demand curve to the left (decrease in demand) can be brought about by the following factors:
- A decrease in people’s incomes.
- A decrease in the price of a substitute product.
- Lower population in the area.
- Negative changes in tastes, fashions and preferences towards the product.
- The introduction of a new but cheaper substitute.
- Deterioration in the terms of sale, e.g., lower discounts.
A shift of demand curve to the right (increase in demand) can be as a result of:
- An increase in people’s incomes.
- An increase in the price of a substitute product.
- An increase in population.
- An improvement in terms of sale, e.g., where better discounts are given.
- A decrease in the price of a complementary product.
- An improvement in tastes and preferences towards a particular product.
Differences between a movement along a demand curve and a shift of a demand curve
| Movement along a demand curve | Shift of a demand curve |
| It involves two demand curves. |
| Brought about by a change in other factors that influence demand other than the price of the product. |
| Involves a change in demand. |
| A different quantity is demanded at the same price as before. |
| A shift causes the curve to move either to the right or left. |
SUPPLY
Supply is defined as the quantity that suppliers are willing and able to take to market at a given price over a given period of time.
Factors which influence supply of a product
- The price of the product: the higher the price, the higher the supply; while the lower the price, the lower the supply.
- The cost of production: an increase in the cost of production leads to a reduction in the supply of goods, while a decrease in the cost of production leads to an increase in the supply of goods.
- The level of technology: an improvement in the level of technology leads to a reduction in cost of production and an increase in supply.
- The government policy: this includes the imposition of taxes, subsidies, quotas, and price controls. Taxes increase the cost of production; hence supply will decrease. A subsidy lowers the cost of production, leading to an increase in supply. Imposition of quotas places an upper limit on the quantity that may be supplied irrespective of the price. Where the government sets prices, firms will react accordingly. If the price set is high, the supply will be high; if the price set is low, the supply will also be low.
- Availability of inputs: shortage of raw materials leads to low production, hence low supply.
- Future expectations of price changes: where producers expect the price of goods to increase in the future, they may decide to restrict supply until prices go up.
- Natural factors: bad weather like droughts and floods leads to poor harvests, hence low supply of agricultural products. Favorable weather conditions lead to more harvests, hence more supply.
Supply schedule and supply curve
A supply schedule is a table showing the relationship between supply of a commodity and its price. It shows the quantity supplied at various prices. The supply curve is a graphical illustration showing the trend taken by supply as price either increases or decreases.
Draw a supply curve using the figures given in the supply curve below.
| Price of x | 2 | 4 | 6 | 8 | 10 | 12 | 14 | 16 | 18 |
| Supply of x | 5 | 10 | 15 | 20 | 25 | 30 | 35 | 40 | 45 |
The supply curve (SS) slopes from the left to the right showing that as the price increases, the supply also increases. For example, at a price of Shs. 8, the supply is 20 units. As the price goes up to Shs. 16, the supply also goes up to 40 units.
Movement along the supply curve
This is said to be a movement along a supply curve when the quantity supplied of a commodity changes as a result of a change in its price, “all other factors remaining constant.” It leads to a movement from one point to another on the same supply curve as shown below:
In (i) when price changes from OP0 to OP1, the movement is downwards from point X to point Y on the same supply curve S0S0. This leads to the supply of OQ1 instead of OQ0.
In (ii) when the price changes from OP2 to OP3, the movement is upwards from T to point Z on the same supply curve. The quantity supplied changes from OQ2 to OQ3.
Shift of a Supply curve
A shift of the supply curve is when the entire curve moves either to the left or right as a result of changes in factors influencing supply other than the price of the commodity involved.
In (iii) the whole supply curve S2S2 shifts to S3S3 resulting in the reduction of quantity supplied from OQ3 to OQ4 at the same price OP3 as before.
EQUILIBRIUM PRICE AND EQUILIBRIUM QUANTITY