


THIRD TERM
SUBJECT: MATHEMATICS CLASS: JSS 2
SCHEME OF WORK
WEEK TOPIC
- (a) Revision of Second term’s examination
(b) Re-presentation of real situation an graph and the reason(s).
- Angles and Polygon: (i) definition of angles (ii) Construction of move angles (iii) Definition of polygon with examples (iv) sum of interior angles of regular polygon: (n – 2) x 180o
- Angles of Elevation and Depression
- Bearing and Distances
- Statistics: Data Presentation
- Statistics (Continued)
- Review of first half term’s work and periodic test
- Probability
- Pythagoras’ Theorem
- Review of third term’s work and periodic test.
- Revision and Examination
- Examination
REFERENCE
- WABP ESSENTIAL MATHEMATICS FOR JSS BK 2 BY A.J.S. OLUWASANMI
- NEW GENERAL MATHEMATICS BY J.B. CHANNON & ETAL
WEEK ONE
TOPIC: LINEAR GRAPH IN TWO VARIABLES, USING GRAPH TO SOLVE REAL LIFE SITUATION
CONTENT
Distance – Time graph
Velocity Time graph
Re-representation of real-life situation of graphs
Choosing scales.
Distance – Time Graph
Graphs are used to show the relationship between two quantities. A continuous graph is in the form of a continuous line and shows the relationship between the two quantities.
A distance-time graph shows the distance travelled against the time taken and is used to calculate speeds.
A distance-time graph is also called a Travel graph. In travel graph, the time is usually plotted x – axis and the distance on y-axis.
Example
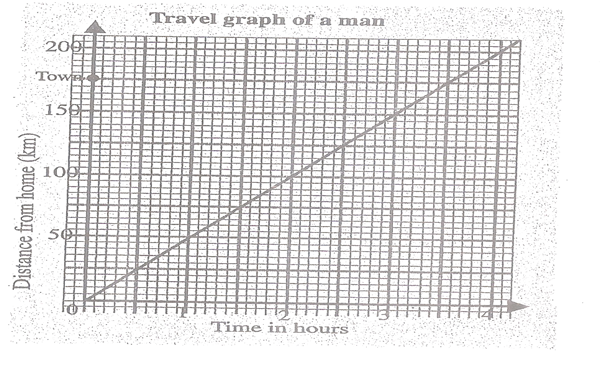
The graph below shows a man’s journey from home to another town. Use the graph to find:
- The time taken to travel 75km
- The distance travelled in 3 hours
- The time taken to cover a distance of 175km
- The man’s speed in km/h
Solution with explanation
The horizontal (or x-axis) shows the time in hours.
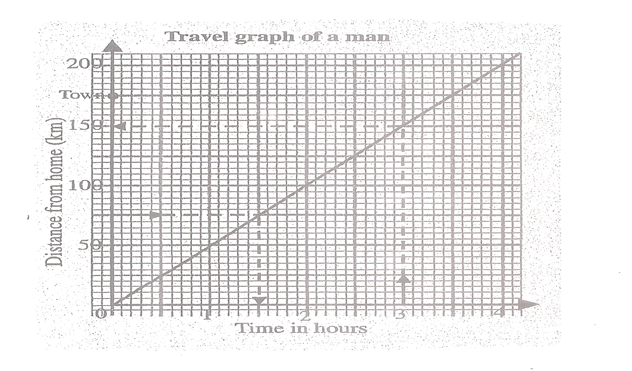
2 units on the x-axis = 1 hour
So 1 unit = hr or 30 mins
The vertical axis (or y-axis) shows the distance in km.
2 units on the y-axis = 50km,
We can use a travel graph to find a distance and time at any point on the graph.
For example:
- The time taken to travel 75km is 1 h 30 mins (see the arrow)
- The distance travelled in 3 hours is 150km (see the arrow)
- It took the man 3 hours 30 mins to cover a distance of 175 km.
- In 3 hrs the man travelled 175km
In 1 hr the man travelled
= =
= 50km/hr
EVALUATION
- A girl walks along a road at a speed of 100m per minute
- Copy and complete the table
Time(s) | 0 | 1 | 2 | 3 | 4 | 5 | 6 |
Distance(m) | 0 | 100 | 200 |
- Using a scale of 2cm to 1min on the horizontal axis and 2cm to 100m on the vertical axis draw the graph of the information
- Use the graph to find
- How far the girl has walked after 4.6mins
- How long it takes her to walk 380m
READING ASSIGNMENT
Essential Mathematics Chapter 16, pgs. 184-187 AJS Oluwasanmi
Exercise 16.6 Nos 1 & 3 page 201
GRAPH OF REAL LIFE SITUATION
Choosing Scale.
In choosing a scale, choose a big scale while drawing graphs. Refer to the given data to find the upper and lower limit of the scale. Always show the origin if possible on 2cm graph paper use scale of 2cm to 1, 2, 5, 10, 20, 50, 100
GENERAL EVALUATION:
- The labour charges preparing a television set consists of a standing charge of N500 on all bills and an hourly rate of N200 per hour.
- Make a table showing the total labour charges for jobs which take 1/2h, 1h, 2h, 3h, 4h,
- Choose a suitable scale and draw a graph of the information
- Find the total labour charge for a job which takes
i. 21/2hrs ii. 24min
Time(hr) | 1/2 | 1 | 2 | 3 | 4 |
Standing | 600 | 700 | 900 | 1100 | 1300 |
READING ASSIGNMENT
New general mathematics, UBE Edition, chapter 122. Pages 105 – 107
Essential mathematics by A J S Oluwasanmi, chapter 18, pgs. 187 – 191
WEEKEND ASSIGNMENT
- Which of the following statements in not true about the equation of the form y = mx + c? A. x and y are called the variables. B. only c is the constant term C. the graph of this equation is always a straight line D. the intercept of the graph on the y axis is c.
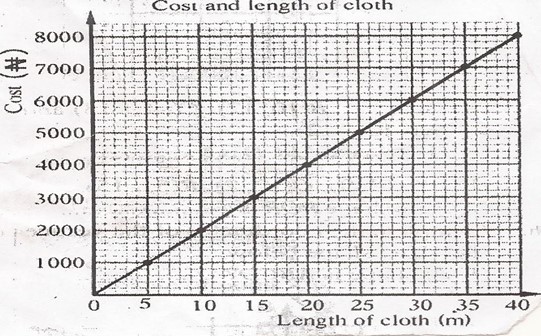
The graph below shows the cost of cloth (in naira) and length of cloth (in metre). Use the graph to answer questions 2 to 5

- Find the cost of 12 metres of cloth. A. N2000 B. N2200 C. N2400 D. N2800
- Find the cost of 38 metres of cloth A. N7600 B. N7200 C. N7400 D. N7800
- How many metres of cloth can be bought for N4400? A. 20m B. 25m C. 24m D. 21m
- How many metres of cloth can be bought for N7800? A. 35m B. 37m C. 38m D. 39m
THEORY
- Essential mathematics bk. 2 exercise 16.6 number 1 page 201
- The table below shows the speed of a train at various times
Time (h) | 0 | 2 | 4 | 6 | 8 | 10 | 14 |
Speed (km/h) | 0 | 15 | 15 | 35 | 35 | 40 | 0 |
- Draw a velocity – time graph for the journey
- Find the acceleration during each stage of journey
- Find the distance covered by the train in the first 4 hours.
WEEK TWO
TOPIC: ANGLES IN POLYGON
CONTENT: (i) Sum of interior angles of a polygon
(ii) Sum of exterior angles of a polygon
DEFINITION OF A POLYGON
A polygon is any close plane figure with straight side. A regular polygon has all sides and angles equal.
Polygon are named according to the number of sides they have. Examples are:
Triangle a 3- sided polygon
Quadrilateral a 4- sided polygon
Pentagon a 5- sided polygon
Hexagon a 6- sided polygon
Heptagon a 7- sided polygon
Octagon a 8- sided polygon
Nonagon a 9- sided polygon
Decagon a 10- sided polygon
The diagrams below represent some common polygons.
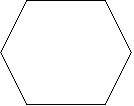
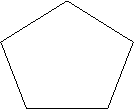
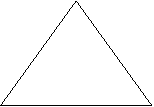
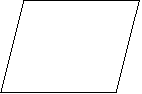
Triangle Quadrilateral Pentagon Hexagon
(3 sided) (4- sided) (5- sided) (6- sided)
Reference
NGM Book 2
Essential Mathematics for junior secondary school Book 2, chapter 9, pages 87 – 88
Sum of Interior Angles of a Polygon
The angles inside a polygon are called its interior angles as shown in the figure below:
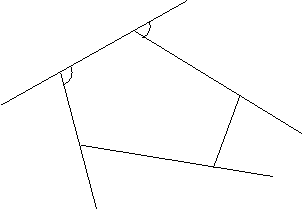
e = exterior angle
i = interior angle
The number of triangles depends on the number of sides of the polygon. For a polygon with ‘n’ sides there will be (n-2) triangles. The sum of angles of a triangle is 1800.
Alternatively, since 1800 = (n-2) x 2 x 90
= 2(n-2) 90
= (2n-4) 90
Thus, the sum of the angles of an n-sided polygon can be represented as (n-2) 1800 or (2n-4) 900
The table below shows the sum of interior angles of a regular polygon of a 3 sided polygon up to a sided polygon.
Polygon | No. of Sides | No. of Triangles (n-2) | Sum of interior Angles (n-2) 1800 |
Triangle | 3 | 3 – 2 = 1 | 1 x 1800 = 180 |
Quadrilateral | 4 | 4 – 2 = 2 | 2 x 1800 = 3600 |
Pentagon | 5 | 5 – 2 = 3 | 3 x 1800 = 5400 |
Hexagon | 6 | 6 – 2 = 4 | 4 x 1800 = 7200 |
Heptagon | 7 | 7 – 2 = 5 | 5 x 1800 = 9000 |
Octagon | 8 | 8 – 2 = 6 | 6 x 1800 = 10800 |
Nonagon | 9 | 9 – 2 = 7 | 7 x 1800 = 12600 |
Decagon | 10 | 10 – 2 = 8 | 8 x 1800 = 14400 |
Worked Examples:
- Calculate the size of exterior angle of a regular nonagon (9 sides)
- Calculate the size of exterior angle of a regular hexagon (6 sides)
Answer to the evaluation questions
- Sum of exterior of a polygon = 3600. Number of sides of a nonagon = 9
Size of each exterior angle = sum of exterior angles/number of sides.
=
= 40o
- Sum of exterior angles = 360o
Hexagon has 6 sides.
= = 60o
GENERAL EVALUATION
- The interior angles of a triangle add up to …………………………
- The interior angles of a quadrilateral add up to ………………………
- The sum of the interior angles of a regular polygon is 1080o. How many sides has the polygon?
REVISION QUESTION
- Calculate the number of sides of each of a regular polygon whose interior angle is 162o
- The sum of the 3 angles of a hexagon is 345o. If the other angles are equal. Find the sizes of each of the angle.
READING ASSIGNMENT
Essential Mathematics for junior secondary school Book 2, Chapter 19, page 252 – 255
Exercise 19.5 No 1 page 255
WEEKEND ASSIGNMENT
- The sum of interior for angle of a regular pentagon is A. 240o B. 720o C. 540o D. 640o
- Calculate the size of each of exterior angle of a regular hexagon. A. 60o B. 30o C. 45o D. 125o
- The size of each angle of a regular octagon will be ____ A. 95o B. 75o C. 105o D. 135o
- How many sides has a polygon if the sum of interior angles of that polygon gives 3240o? A. 18o B. 15o C. 17o D. 20o
- Calculate the size of each exterior angles of a pentagon A. 30o B, 72o C. 60o D. 90o
THEORY
- Calculate A. The total internal angels of an octagon B. The size of each angle of a regular octagon
- Calculate the
- Exterior angle
- The number of sides of a regular polygon with an interior angle of 72o
WEEK TWO
TOPIC: GRAPHS OF LINEAR EQUATIONS
CONTENT: (i) Equations and table of values
(ii) Plotting points from the table of values
(iii) General form of linear equations
Equations and Table of Values
y = 2x – 5 is an equation of x and y. the equation connects the two variables x and y so that for any value of, there is a corresponding value of y. For example if x = 3, then y = 1 and if x = -2, y = -9. Table below is a table of values that shows corresponding values of the variables x and y for the equation y = 2x – 5. We say that y is the dependent variable since the value of y depends on the value of x. c is the independent variable.
x | -2 | -1 | 0 | 1 | 2 | 3 | 4 |
2x | |||||||
-5 | |||||||
y = 2x – 5 |
Evaluation: Copy and complete the table above.
Plotting Points from the Table of Values:
Table above contains the following set of ordered pairs of corresponding values of x and y. (-2, -9), (-1, -7) … These ordered pairs are equivalent to a set of coordinates of points that can be plotted on the Cartesian plane. y = 2x – 5 is a linear equation in x and the variables in a linear equation are always separate and have a power of 1 (i.e. there are no terms such as xy, x2, y3 etc.). The graph of a linear equation is always a straight line. In general, a straight line has an equation in the form y = mx + c, where x and y are variables and m and c are constants.
Evaluation: Draw the graph of y = 4x – 7 for values of x from -3 to +3. From your graph find:
- The value of y when x = 2.5
- The value of x when y = -1.3
- The coordinates of the points where the line cuts the axes.
General Form of Linear Equations:
The general form for the equation of a straight line is y = mx + c. Where m and c are constants. m is the coefficient of x and it is often called the gradient of the line. c is called the intercept on the y-axis. When a linear equation is given in this form, the values of m and c can easily be obtained. As shown below.
If y = -5x – 4, then m = -5 and c = -4
ax + by + c = 0 is another form of equation of a line. Notice that the terms are in alphabetical order. Where a, b and c are constants.
For example: 3x – 2y – 10 = 0 is in the form ax + by + c = 0, where a = 3, b = -2, and c = -10
To obtain m and c in the above equation, there is need to convert it to the form y = mx + c
Example: Find the values of m and c in the equation 2x – y + 7 = 0
Solution:
Given: 2x – y + 7 = 0, add y to both sides
2x + 7 = y
i.e. y = 2x + 7 (in the form y = mx + c)
Thus, m = 2 and c = 7
Evaluation:
- The equations of six straight lines are:
y = x + 3; y = 2x – 3; y = x – 3; y = 2x + 8; y = 2x – 7; y = x – 5
- Which of these lines are parallel?
- Write down the values of m and c, where m is the gradient and c is the intercept on the y-axis.
GENERAL EVALUATION
- Draw the graph of y = 3x – 4 for values of x from -2 to 2
- Write down the coordinates of the points where the graph cuts the y-axis
REVISION QUESTION
- Draw the graph of y = -5 – 3x for -4 x 3
- Find the coordinates of the points where the line cuts the axes.
READING ASSIGNMENT
WABP Essential Mathematics. AJS Oluwasanmi. Chapter 16 pg. 182 – 185
Exercise 16.3 No 5&7 page 191
WEEKEND ASSIGNMENTS
- Given that y = 3x – 5, find m A. -5 B. -3 C. 3 D. 5
- If y = -2x + 7, find c A. -2 B. 7 C. 2 D. -7
- Given an equation of a straight line: 2y + 6x – 10 = 0, find the gradient A. 6 B. 3 C. -6 D. -3
- In question (3) above, find the intercept on the y-axis A. 2 B. 6 C. -10 D. 5
- Given the equations (i) y = 2x – 3, (ii) y = x + 3 and (iii) y = 2x + 8. Which of these are parallel? A. i and iii B. i and iii C. ii and iii D. i, ii and iii
THEORY
- Draw the graphs of the functions y + 3x – 4 and x – y = 5 on the same axes. Write down the coordinates of the point where both lines intersect.
- Find the x and y intercepts of the following lines a. 3x – 9 = 2y b. 2y – x + 3 = 0
WEEK THREE
TOPIC: ANGLES OF ELEVATION AND DEPRESSION
CONTENT: (i) Horizontal and vertical lines
(ii) Angles of elevation
(iii) Measuring angles of elevation and depression
Horizontal and Vertical Lines
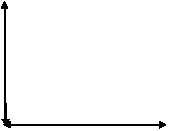
Horizontal lines are lines that are parallel to the earth. For example, the surface of a liquid in a container, floor of a classroom, etc. Seethe diagram below:
 Horizontal line
Vertical lines are lines that are perpendicular to the horizontal surface, e.g. Wall of a classroom, a swing pendulum, etc.

Evaluation:
- Say whether the following are horizontal or vertical or neither.
a) A table top b) A door c) A table leg d) Top edge of a well
Reading Assignment
NGM BK 2 Chapter 17, pg. 173
Essential Mathematics for JSS BK 2, Chapter 17, pg. 173
Angles of Elevation
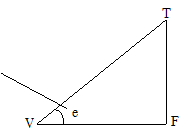
The angle of elevation of an object from a given point is the angle formed when an observer looks up to see an object his head. See the diagram below.
angle of
elevation
Horizontal plane
V = view point, T = top where the object is, F = foot of the vertical plane, e = angle of elevation
Reading Assignment
NGM BK 2 Chapter 20, page 165
Essential Mathematics for JSS BK 2, Chapter 17, pg 173
Angle of Depression
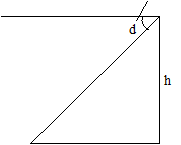
 The angle of depression of an object from a given point T is the angle formed when an observer looks down to see an object below his head.
 Horizontal
Thus the angle of elevation is equal in size to the angle of depression. (Alternate angles are equal i.e. d = e)
NGM BK 2 Chapter 20, pgs. 166 – 167
Measuring Angles of Elevation and Depression
When constructing angles of elevation and depression, the use of scale drawing is necessary in order to have effective construction of angle. Consider the diagram below; find the height of the flagpole to the nearest metre using suitable scale.
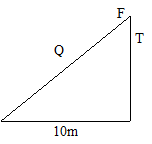
Solution
By construction, choose a scale of 1cm represent 2m.
The height of the flagpole PT = 3cm, converted to m, will give 2 x 3 = 6
Example 2: The angle of elevation of the top of a tower 42m away from a point on the level ground is 36o, find the height of the tower.
Solution 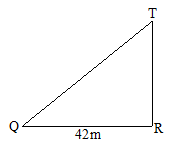
By construction, using a suitable scale of 1cm represented by 6cm, then PR = = 7cm
The length TR = 5.0cm converting back to metre, we have;
Length TR = 5 x 6 = 30m
Example 3: From the top of a building 20m high, the angle of depression of a car is 45o, find the distance of the car from the foot of the building.
Solution
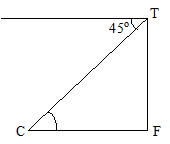 Rough sketch:
T = top of the building, C = car, F = foot of the building
CF is the distance of the car from the foot of the building
Since angle of depression equal angle of elevation;
By construction, using a suitable scale of 1cm represents 5m
For 20m, we have = 4cm
Length CF 4cm
By conversion, length CF = 4 x 5 = 20m
EVALUATION
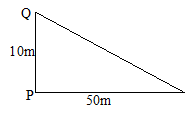
- A tower PQ is 10m high, if the distance from point R to P is 50m on the ground, find the angle of elevation of Q from R
- From the top of a cliff of 200m high, Martins observes that the angle of depression of a boat at sea is 35o, find the distance between the boat and the foot of the cliff.
GENERAL EVALUATION
- A boat is 180m from the foot of a vertical cliff of height 80m. find by scale drawing the angle of depression of the boat measured from the top of the cliff.
- A boy is flying a kite. The string is 25m long and is at an angle of 42o with the horizontal. Using a scale diagram, find the high the kite is above the boy’s head?
REVISION QUESTION
- The angle of elevation of point P from point Q is 40o. PQ = 45km. How high is point P above the level of point Q.
- A girl with eyes-level height of 1.65m observes that the angle of elevation of the top of the tower 20m away is 40o. Calculate the height of the tower.
READING ASSIGNMENT
NGM BK 2 chapter 20, page 166 – 169
Essential mathematics for JSS BK 2, chapter 23, pg. 295 – 297
Exercise 23.1 No 1, 2 & 3 page 296
WEEKEND ASSIGNMENT
- Calculate the size of the fourth angle if three angles of quadrilateral are 65o, 115o and 125o respectively A. 35o B. 55o C. 45o D. 75o
- Calculate the number of side of a regular polygon whose total angles is 1080o A. 4 B. 6 C. 8 D. 10
- PRQS is a rectangle with the side 3cm and 4cm, if its diagonal cross at O, calculate the length of PO. A. 3.5cm B. 5.0cm C. 2.5cm D. 4.0cm
- If the angle of a quadrilateral could be x, 2x, 4x and 5x respectively, what would be value of x? A. 60o B. 90o C. 15o D. 30o
- If the angle of elevation of a building from a point on the ground is 43o. What is the angle of depression? A. 47o C. 53o C. 43o D. 32o
THEORY
- From the top of a building 50m high, the angle of depression of a car is 55o, find the distance of the car from the foot of the building.
- Find the height of the flagpole in the diagram below to the nearest metre.
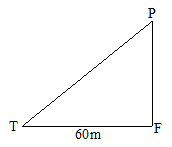
flagpole

WEEK FOUR
TOPIC: BEARINGS
CONTENT: i. Compass bearing
ii. Three figure bearing
iii. Finding the bearing of a point from another
COMPASS BEARING
A bearing gives the direction between two points in terms of an angle in degrees. The two types of bearing are compass bearing and three– figure bearings.
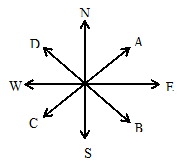
The four major compass directions are North (N) South (S) East (E) and West (W)
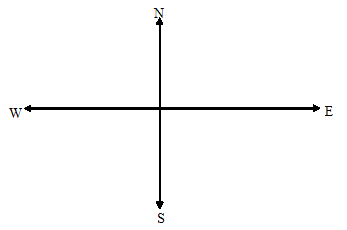
In compass bearing, the angles are measured from north to south depending on which one is nearer
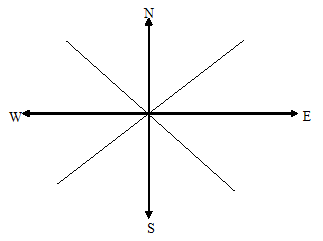


Apart from the four main points or directions, there are also four main secondary direction i.e. NE (north east), SE (south east), SW (south west), NW (north west). The angles between each point is 45o
Worked examples
Draw a sketch to show each of these bearings marketing the angles clearly.
a) N35oW B. N70oE C. S58oW
Solution
- N35oW means from N, measures 35o toward the W or 35oW of N
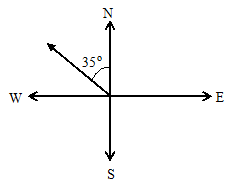
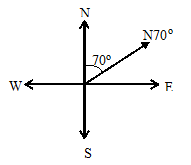 b) N700E means 70o toward E.
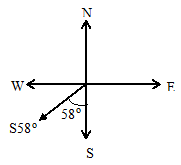 c) S58oW means from S measures 58o toward W.
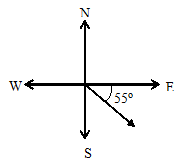
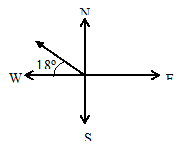
- State the compass direction of the following diagrams:a) b)
Solution
In a), the direction start from a wrong point (W) instead of N, therefore,
90 – 18 = 72o
i.e. N72oW
In b), the direction starts from a wrong point (E) instead of S therefore:
90 – 55 = 35o i.e. S35oE
Evaluation: Class Work
Find the compass direction of point A from point O in these diagrams.
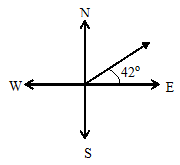
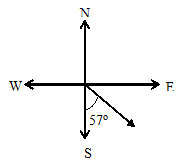

 a) b)
a) b)
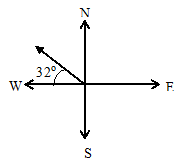
c)
Reading Assignment
NGM BK CHAPTER 23, page 185 – 187
Essential Mathematics for JSS BK 2, CHAPTER 24, pg 246-247
THREE-FIGURE BEARINGS
Three-figure bearings are given as the number of degrees from north, measured in a clockwise direction. Any direction can be given as a three figure bearing. Three digit are always given but angles less than 100o need extra zero to be written in front of the digits e.g. 008o, 060o, 070o up to 099o
Worked Examples
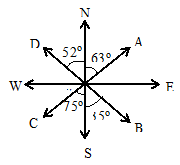 Find the three figure bearings of A, B, C, and D from X.
Solution
- The arrow N shows the direction N, NXA = 63o. the bearing of A from X is 063o
- NXB = 180 – 35 = 145o. The bearing of B from X is 145o
- NXC clockwise = 180 + 75 = 255o. The bearing of C from X is 255o
- NXD clockwise = 360 – 52 = 308o. The bearing of D from X is 308o.
Evaluation:
In the figure below, find the bearings of A, B, C and D from X.


Reference
NGM Bk. 2 Chapter 23, page 180 – 190.
To find the bearing of B from A
By constructing line N2A
180 + 57 = 237o
- The bearing of B from A is 237o
- The bearing of A from B is 057o
- The bearing of X from Y is 3190. Calculate the bearing of Y from X.
- In each diagram, calculate i) the bearing of B from A and ii) the bearing of A from B.
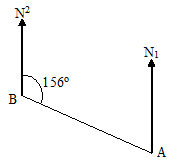
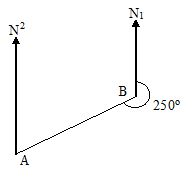
GENERAL EVALUATION
From a point P the bearing of a house is 060o. From a point Q 100m due east of P, the bearing is 330o.
Draw a labeled sketch to show the positions of P, Q and the house.
REVISION QUESTION
- A girl is facing East. If she turns clockwise through 2 right angles, then the direction she would be facing is ……………………..
- A student is facing South East. If he turns anticlockwise through 1800, then the direction he would be facing is …………………..
WEEKEND ASSIGNMENT
- The bearing of X from Y is 196o. The bearing of Y from X is A. 016o B. 074o C. 106o D. 196o
- A boat sails on a bearing of 225o. Using compass bearing, in what direction is the boat sailing? A. South East B. North East C. South West D. North West
- The bearing of point A from B is 058o. Find the bearing of point B from point A. 058o B. 122o C. 3020 D. 238o
- Which of the following statements is not true when we specify a direction with bearing? A. Measure the angle from North B. Measure anticlockwise C. Measure clockwise D. Always use three digits
- In the diagram below, which of the following angles is the bearing of P from Q? A. 065o B. 2450 C. 295o D. 115o
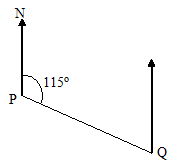
WEEK FIVE
TOPIC: DATA STATISTICS REPRESENTATION
CONTENT: 1. Definition
2. Method of collecting data
3. Classification of data
DEFINITION
- Statistics: is the branch of study of data. It involves (a) Gathering (i.e. collecting) data (b) sorting and tabulating data (c) presenting data visually by means of diagrams.
- Data: (SINGULAR DATUM) means information which are usually given in the form of meaningful. Data may be categorized into quantitative and qualitative
- Discrete data: are data which can be obtained by counting (not by measurement). Discrete data can only exact values such as whole numbers. E.g. 2 boys, 3 houses etc. hence discrete data have definite or exact values
- Continuous Data: are data that can be obtained by measurement (not by counting). Continuous data can take any values within a given range. E.g. height 1.6cm, height 40.56cm etc.
- Qualitative Date: this is a non-numerical value which is concerned with qualities such as names, places, color, taste, opinions, brightness etc.
Evaluation
Explain briefly with an example (i) Discrete data (ii) Continuous data
METHOD OF COLLECTING DATA
There are two discrete ways of collecting data. These are (a) by carrying out experiment (b) by survey
- By Carrying out Experiments: Data can be obtained from experimental work carried out in the laboratories by students or scientist for example, various measurements, such as temperature, pressure, weight and height of an object can be obtained by setting up an experiments.
- By Survey: This collection of information or data on a subject. A survey may be carried out by using the existing published data, making observation and asking questions.
- Using existing published data: Existing data may be obtained from libraries, schools, newspaper, and government’s publications such as annual abstract of statistics, stake statistics, employment gazettes, books journals and other publications.
- Making Observation: This method involves collecting data by observation e.g. you can do a round traffic survey by counting and recording the various types of vehicles that ply a particular road.
- Asking questions: You can ask other people questions to obtain their views or vital information in two ways: i. by interviewing them ii. By giving those questionnaires to fill in their response.
- By Interviewing: This involves asking other people questions in order to obtain vital information or strict pattern or information, in which the questions asked only general formal but the order or the way the questions are presented can vary. It must be noted that the interviewers must avoid bias, misleading ambiguous and offensive questions.
- Questionnaires: This is the most popular method of collecting data. Questionnaires are list of questions designed to obtain or discover particular information in a survey. In questionnaires, everyone is asked the same questions. The questionnaires may be given directly to an individual or sent to them by post to fill in their response. The main advantage of postal questionnaires is that it can be sent to many people in another towns or cities.
Evaluation
Mention two major ways that data can be collected.
Reading Assignment
Essential mathematics for JSS 2 by AJS Oluwasanmi pages 180 – 182
CLASSIFICATION OF DATA
Data can be obtained either by direct collection from respondents or form a data bank of a data collection agency. Data collected directly from information’s are called
- Primary Data: are those from data banks are called secondary data.
- Secondary Data: these are obtained from data collection agencies, engaged in routine data collection for research and planning some of these agencies include:
- Federal Office of Statistics (FOS) Principal agency
- Central Bank of Nigeria
- Statistics units of Ministries/Parastatals
- Commercial Companies/ Industries.
GENERAL EVALUATION
- Name two broad ways of classification of data
- Mention two agencies we can collect secondary data
REVISION QUESTION
Michael obtained the following scores in a Basic Technology examination:
65, 72, 58, 82, 74, 64, 78, 70, 80, 75, 68
Arrange these scores:
- In ascending order
- In descending order
READING ASSIGNMENT
Essential Mathematics for JSS 2 by AJS Oluwasanmi chapter 23 pages 298–302.
Exercise 23.2 No 2&3 page 300
WEEKEND ASSIGNMENT
- Which one of the following is a discrete data A. 1.25 B. C. D. 5
- Data that is written in radius order is called A. qualitative data B. raw data C. quantitative data D. discrete data E. continuous data
- Which of the following most a questionnaires be? A. simple B. misleading C. ambiguous D. irreverent E. offensive
- We can represent data by _____________ A. line B. dist C. number D. picture E. double lines
- Statistics deals majorly on ___________ A. building B. dancing C. data D. fish E. animals
THEORY
- Mention 3 things you must avoid when designing a questionnaires
- In carrying out a survey, mention two ways, you can obtain information from people.
WEEK SIX
TOPIC: PRESENTATION OF DATA: IN LIST, TABLE AND LINE GRAPH
CONTENT: i. Rank order list
ii. Frequency table
iii. The line graph
RANK ORDER LIST
Raw data: Data which is in random order (i.e.) arranged in any kind of order is called raw data. One way to present or organize the data in a more meaningful way is to arrange it in rank order or sorting it into categories. Rank order means in order from highest to lowest. Note: Data should be presented clearly. Good presentation makes statistical data easy to read and understand.
Example: B,C,A,B,A,D,E,C,A,B,B,E,B. this 15 grade are given rank order below:
A,A,AB,B,B,B,C,C,C,D,E,E,F.
Reading Assignment
- New general mathematics for JSS 1 by JB Channon and other page 125
- Essential mathematics for JSS 1 by AJS Oluwasanmi page 183
FREQUENCY TABLE
Raw can also be arranged in a table called the frequency table as shown in the diagram below. The number of times each particular value occurs is called its frequency. The frequency table is usually made up of three columns.
- The first column contains each item (or each of the events) given in the raw data and they are usually arranged in order of magnitude starting with the smallest.
- The second column contains the tally charts which represent the number of times a particular item or events takes place.
Example: 2, 5, 4, 6,3, 4, 7, 5, 7, 7, 8, 9, 5, 3,4, 4, 8, 2, 2, 2, 5
Vehicles | Tally | Frequency |
2 | III | 3 |
3 | III | 3 |
4 | IIII | 5 |
5 | IIII | 4 |
6 | I | 1 |
7 | IIII | 4 |
8 | II | 2 |
9 | I | 1 |
TOTAL | 25 |
Evaluation
The following figures show the number of children performing in a sample of 40 households.
1, 2, 4, 3, 5, 8, 3, 2, 2, 3, 4, 5, 6, 5, 4, 2, 1, 3, 2, 4, 5, 3, 8, 7, 6, 3, 8, 6, 3, 5, 7, 5, 4, 3
- Use a tally mark to prepare a frequency table for this data.
- What is the highest frequency to numbers of children per family?
Reading Assignment
Essential mathematics by AJS Oluwasanmi page 184 – 185
THE LINE GRAPH
A line Graph is a bar-chart with bar replaced by straight lines which represent the frequency of each item.
Example: The scores of 30 students in mathematics test are shown below
8, 6, 2, 0, 0, 2, 4, 1, 0, 6
4, 2, 8, 8, 1, 0, 0, 2, 4, 2
2, 8, 6, 4, 1, 0, 0, 6, 2, 4
Use the frequency table to construct a line-graph solution
Vehicles | Tally | Frequency |
0 | IIII II | 7 |
1 | III | 3 |
2 | IIII II | 7 |
4 | IIII | 5 |
6 | IIII | 4 |
6 | IIII | 4 |
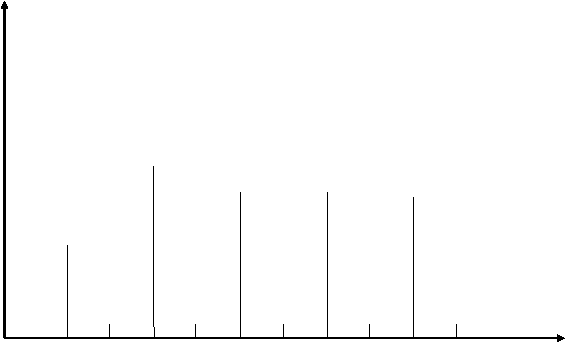 Line-Graph for students mathematics test scores.
10
9
8
7

6
5
4
3
2
1
 0 2 4 6 8 10
GENERAL EVALUATION QUESTION
Twenty four pupils went out to pick some pears. The number of pears picked by each pupil was recorded as follows:
6, 4, 3, 2, 3, 4, 1, 3, 5, 1, 6, 2,
2, 3, 2, 2, 3, 5, 2, 4, 3, 3, 1, 6
- Prepare a tally sheet and frequency table for the data
- Construct a line-graph for the distribution
- Which is the least number of pears picked?
REVISION QUESTION
The shoe sizes of 20 boys are as follows:
8, 10, 9, 10, 11, 9, 8, 9, 12, 9
10, 9, 9, 8, 8, 9, 10, 19, 9, 11
- Prepare a tally sheet and frequency table for the data
- Which shoe size is the most common among the boys?
- How many boys wear size 10 and above?
READING ASSIGNMENT
Essential Mathematics for JSS 2 chapter 23, pages 295 – 298
Exercise 23.2 No 7 pages 301
WEEKEND ASSIGNMENT
- What number is represented by the tally marks shown below?


 IIII IIII IIII III
A. 18 B. 23 C. 13 D. 43
The table below shows the marks obtained by students in a physics test.
Mark | 5 | 6 | 7 | 8 | 9 | 10 |
Tally | II | II | IIII I | IIII III | III | IIII |
- How many students did the test? A. 35 B. 34 C. 30 D. 25
- What mark did most students get? A. 5 B. 9 C. 8 D. 7
- If 8 is the pass mark, what fraction of the students failed the test? A. B. C. D.
- The most frequency used value occurring in a set of data is known as A. median B. mean C. average D. mode
THEORY
- The scores of some students in mathematics test were as follows: 1, 0, 7, 7, 8, 6, 1, 0, 8, 8, 9, 6, 5, 9, 9, 8, 8, 5, 5, 1, 0, 9, 9, 8, 9, 7, 5, 9, 7, 1, 0, 8, 6, 7, 7, 8, 1, 0
- Form a frequency table distribution
- How many students wrote the test?
- How many students scored less than seven?
- Which score occurred most often
- The following are the number of goals during inter-house football competition in a certain school.
5 0 4 2 5 1 3
2 4 0 0 3 0 2
1 2 3 3 4 0 5
Draw line graph for the data.
WEEK SEVEN
TOPIC: PICTORIAL PRESENTATION OF DATA USING PICTOGRAM, PIE CHARTS AND BAR CHARTS
CONTENT: i) The Pictogram
ii) The bar charts
iii) The pie charts
INTRODUCTION
A frequency table is a numerical presentation of data in an organized summary from. Diagrams, symbols and pictures sometimes catch the eye more quickly than the number. They also tell stories more easily than numbers. It is also observed that it is easier to understand frequency table than the raw data, another method of presenting data, which most graphical find easier than table, is observe method. Graphs help us to observe any patterns easily. Examples of these graphs are pictogram, bar chart, line graph and pie chart.
THE PICTOGRAM
This uses pictures to represent statistics information or data. The pictogram is also called an ideograph. A pictogram uses pictures or drawings to give a quick and easy meaning to statistical data. A pictogram is a simple way of representing data in which a number of identical drawings or pictures and used to show the data. It is useful to use pictures which can easily be divided into halves, quarters and do on. A pictogram must have a key to show that each picture stands for. Also you need to give the diagram a title
Example: The following table shows the favorite sports of 75 students
Represent the data in the form of a pictogram.
 Favouritesports Frequency
Football 25
Wrestling 10
Boxing 5
TableTennis 15
Swimming 20
Evaluation Question
The following table shows the number of students in JSS 1 in different houses at a certain school.
Represent the data in the form of a pictogram
House | Blue | Yellow | Green | Purple |
Students | 16 | 14 | 11 | 21 |
Reading Assignment
- Essential mathematics for JSS 1 by AJS Oluwasanmi page 187
- New general mathematics for JSS 1 by AJS Channon other. Page 125
- MAN mathematics for JSS 1 page 211
THE BAR CHARTS
Bar chart is very like a pictogram. The bars have the same width and usually have equal spaces between them. Instead of using pictures as in case of the pictogram, we must use a bar to represent the frequency of each of the item. In drawing a bar chart, we must take the following features into consideration.
- The charts consists of bars
- The bars must be of equal width
- The lengths of the bars are in proportion of the frequencies being represented. The bars may be vertical or horizontal
Example
The following figures show the number of children per family in a sample of 40 households
1, 2, 4, 3, 4, 3, 8, 3, 2, 2, 3, 2, 5, 6,
5, 4, 2, 1, 3, 2, 4, 5, 3, 8, 7, 6, 5,
4, 5, 7, 6, 3, 8, 6, 3, 5, 7, 5, 4, 3
- Prepare a frequency table for this data
- Draw a bar chart to illustrate the above data
Solution
- Frequency table
No of children per family | 1 | 2 | 3 | 4 | 5 | 6 | 7 | 8 |
frequency | 2 | 5 | 9 | 7 | 7 | 4 | 3 | 3 |
(b)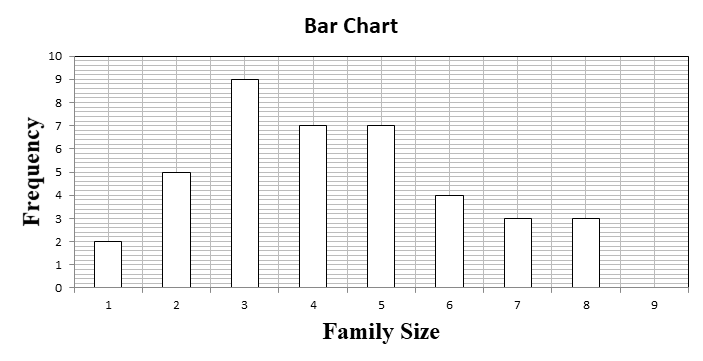
Evaluation Question
The table below shows different colours of cars found in a company’s car park. Draw a bar chart for this data.
Colour of cars | White | Blue | Red | Grey | black |
Frequency | 20 | 17 | 10 | 8 | 15 |
Reading Assignment
Essential Mathematics for JSS 2 by AJS Oluwasanmi page 188
THE PIE CHART
A pie chart is a circle, which is divided into slices (i.e. sectors) whose angles are used to display data.
The size of an angle of each sector gives the frequency of each value. The major advantage of a pie chart is that it enables us to see clearly how the size of parts are compared in relation to one another and to the overall total. It is important to label each sector according to the given items and also give pie chart a little.
Example: A student was given N600.00 in June as a pocket money. He spent the money as follows:
Food = N200.00
Transport = N100.00
Books = N120.00
Rent = N150.00
Miscellaneous= N30.00
Draw a pie chart to illustrate the data.
Solution
There are 360o in a full circle and the total amount spent was N600.00 this means N600.00 is represented by 360o N1 is represented by = 0.6
= 200 x 0.6
= 120o
Items | Amount Spent in Naira (N) | Angle |
Food | 200 | 200 x 0.6 = 120o |
Transport | 100 | 100 x 0.6 = 60o |
Books | 120 | 120 x 0.6 = 72o |
Rent | 150 | 150 x 0.6 = 90o |
Miscellaneous | 30 | 30 x 0.6 = 18o |
TOTAL | 600 | 360o |
120o + 60o + 72o + 90o + 18o = 360o
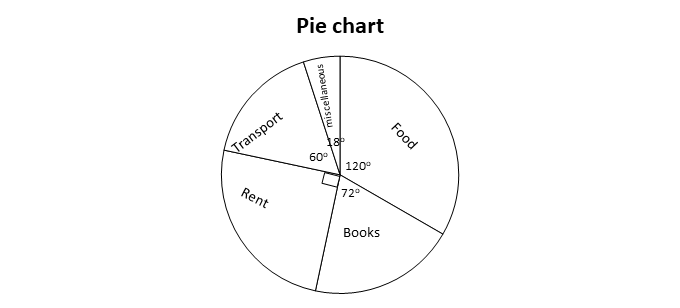
GENERAL EVALUATION QUESTION
400 students were asked whether they liked yam, cornflakes, bread, rice or some other type of food for breakfast, the following data was recorded.
Type of Food | Yam | Cornflakes | Bread | Rice | Other | Total |
Frequency | 65 | 110 | 80 | 120 | 25 | 400 |
Draw a bar and a pie chart to represent this information
READING ASSIGNMENT
Essential Mathematics Bk. 2 pages 303 – 307. Exercise 24.2 No 1 and page 304
WEEKEND ASSIGNMENT
- Which of the following is not a pictorial form of presenting data?
A. Bar chart B. Pie chart C. Frequency distribution D. Line graph
The pie chart below shows the course which a group of students are doing. Use the pie chart to answer questions 2 to 5
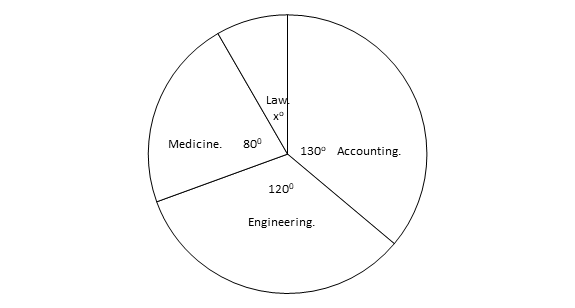
- What is the value of angle xo? A. 20o B. 30o C. 40o D. 35o
- Which course most students doing? A. Engineering B. Accounting C. Law D. Medicine
- Which course has the least number of students? A. Engineering B. Accounting C. Law D. Medicine
- What fraction of the students are doing Engineering? A. B. C. D.
THEORY
- 40 youths who were admitted into a mental hospital due to drug abuse were asked to name the types of drugs they often take. The table shows how they replied.
Indian hemp 35%
Morphine 20%
Heroine 15%
Cocaine 30%
- Represent this information in a pie chart
- Find the number of youths in each category
WEEK EIGHT
TOPIC: EXPERIMENTAL PROBABILITY
CONTENT: i. Experimental Probability
ii. Probability as a fraction
EXPERIMENTAL PROBABILITY
When experimental data are used to predict further events, the prediction is called Experimental Probability. The following examples explain it further:
Example 1: A girl writes down the number of males and female children of her mother and father. She also writes down the number of male and female children of her parents’ brothers and sisters. Her results are shown below:
Number of Children | ||
Male | Female | |
Mother and father | 2 | 5 |
Mother’s brothers | 6 | 8 |
Mother’s sister | 4 | 8 |
Father’s brothers | 5 | 8 |
Father’s sisters | 7 | 7 |
Totals | 24 | 36 |
- Find the experimental probability that hen the girl has children of her own; her first born will be a girl.
- If the girl eventually has 5 children, how many are likely to be male?
Solution
- In the girl’s family, there are a total of 60 children. 36 of these are female. If the girl’s own children follow the pattern of her family, then the experimental probability that her first born will be a girl is
=
- Following the family pattern of the girl’s children will be female and will be male. Number of male children that the girl is likely to have = of 5 = 2
Evaluation
- Roll the die 50 times
- How many times did you roll a 6?
- What is the experimental probability of obtaining a 6 on the die?
- Write down the numbers of male and female children in your family. Follow the example above; find the experimental probability that your first born child will be a boy.
PROBABILITY AS A FRACTION
Probability is a measure of the likelihood of a required outcome happening. It is usually given as a fraction.
Probability =
If an outcome is certain to happen, its probability is 1. If an outcome is certain not to happen, its probability is 0 (zero). If the probability of an event happening is P, the probability of the event not happening is 1-p.
Example1: it is known that out of every 1000 new cars, 50 develop a mechanical fault in the first 3 months. What is the probability of buying a car that will develop a mechanical fault within 3 months?
Solution
Number of cars developing faults = 50
Number of cars altogether = 1000
Probability of buying a faulty car = =.
Example2: A market trader has 100 oranges for sale. Four of them are bad. What is the probability that an orange chosen at random is good? ‘At random’ means ‘without carefully chosen’.
Solution
Either:
Four out of 100 oranges are bad, thus 96 out of 100 oranges are good.
Probability of getting a good orange = =
Or:
Probability of getting a bad orange = = .
Thus,
Probability of getting a good orange = 1 – = .
Example3: City school enters candidates for the WASSCE. The results for the years 1996 to 2000 are given below:
Year | 1996 | 1997 | 1998 | 1999 | 2000 |
Number of candidate | 86 | 93 | 102 | 117 | 116 |
Number Getting WASSCE Passes | 51 | 56 | 57 | 65 | 70 |
- Find the school’s success rate as a percentage.
- What is the approximate probability of a student at City School getting a WASSCE pass?
Solution
- Total number of passes = 51 + 56 + 57 + 65 + 70 = 299
Total number of candidates = 86 + 93 + 102 + 117 + 116 = 514
Success rate as a fraction = = 0.58 to 2 s.f.
Success rate as a percentage = 0.58 x 100% = 58%
- The probability of a student getting a WASSCE pass = 0.58.
EVALUATION
- a) The probability of passing an exam is 0.8. What is the probability of falling the examination?
b) The probability that a girl win a race 0.6. What is the probability that she loses?
c) The probability that a pen does not write is 0.05. What is the probability that it writes?
READING ASSIGNMENT
NGMFJSS2. Chapter 121
GENERAL EVALUATION
A bag contains 30 blue pens (B), 10 red pens (R) and 60 white pens (W). If a ball is chosen at random, what is the probability of choosing
(a) a blue pen? (b) a red pen? (c) a white pen? (d)a black pen?
REVISION QUESTION
- In a class of 36 students, 20 are boys. What is the probability of choosing at random as the prefect of the class?
- A ludo die is thrown once. Find the probability of obtaining a PRIME number.
READING ASSIGNMENT
Essential Mathematics Bk. 2 pages 257 – 260
Exercise 20.2 No 1a – f page 259
WEEKEND ASSIGNMENT
- A fair die is thrown 900 times. Find the number of times you would expect to get a 6? A. 200 B. 150 C. 250 D. 100
- The probability that it will be cloudy tomorrow is 0.45. What is the probability that it will not be cloudy tomorrow? A. 0.45 B. 0.35 C. 1.25 D. 0.55
- Find the probability of getting an odd number in a single toss of a fair die? A. B. C. D. 1
- A bag contains 5 white, 4 black and 1 blue. One ball is chosen at random. What is the probability that it is black? A. B. C. D.
- What is the probability that an integer chosen at random between 1 and 10 inclusive is even? A. B. C. D.
THEORY
- Out of 10 students, the favourite drink of seven is coke and the favourite drink of the rest is Fanta. One of the students is chosen at random. What is the probability that the favourite drink of the student is
- Coke
- Fanta
- Neither Coke nor Fanta
- Either Coke or Fanta?
- A trader has 100 mangoes for sale. Twenty of them are unripe. Another five of them are bad. If a mango is picked at random, find the probability that it is
- Unripe
- Bad
- Neither unripe nor bad
WEEK NINE
TOPIC: PYTHAGORAS THEOREM (SOLUTION OF TRIANGLE)
CONTENT: i. Pythagoras triple
ii. Pythagoras theorem
iii. Using Pythagoras theorem to solve other related problems.
PYTHAGORAS TRIPLE
The sides of a right-angled triangle can be related to the proof of Pythagoras Triple. A Pythagoras triple is a set of three whole numbers which numbers which gives lengths of the sides of right-angled triangle.
Examples of some common Pythagoras triple are (3, 4, 5), (6, 8, 10). (5, 12, 13), etc.
Worked Example
Which of the following is a Pythagoras triple?
a) (15, 30, 35) b) (33, 56, 65)
Solution
152 + 302 = 225 + 900
= 1125
But 352 = 1225
(15, 30, 35) is not a Pythagoras triple
b) 332 + 562 = 1089 + 3136 = 4225
652 = 4225
Thus, 332 + 562 = 652
(33, 56, 65) is a Pythagoras triple.
Evaluation: Class Work
Find out which of the following are Pythagoras triples.
a) (12, 16, 20) b) (27, 36, 45) c) (14, 24, 28)
Answer to the evaluation question
- (12, 16, 20)
122 + 162 = 144 + 256 = 400
202 = 400
Thus, 122 + 162 = 20
(12, 16, 29) is a Pythagoras triple.
- (27, 36, 45)
272 + 362 = 729 + 1296 = 2025
452 = 2025
Thus, 272 + 362 = 452
(27, 36, 45) is a Pythagoras triple
- (14, 24, 28)
142 + 242 = 196 + 576 = 772
282 772
Thus, 14, 24, 28 is not a Pythagoras triple.
Reference: New General Mathematics Book 2, Chapter 7, Pages 150 – 151
Essential Mathematics for JSS Book 2, Chapter, 21, pages 218 and 219
PYTHAGORAS THEOREM
The Pythagoras’ Theorem states that in any right-angled triangle, the square of the hypotenuse side is equal to the sum of the squares of the two sides.
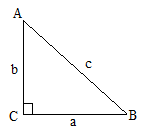
/AB/ = hypotenuse, /BC/ and /AC/ are the other two sides, i.e.
/AB/2 = /BC/2 + /AC/2
Since /AB/ = c, /AC/ = b, /BC/ = a
Then, c2 = a2 + b2
Worked Examples
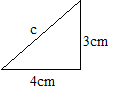
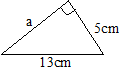
Calculate the length of the two sides of each of the triangle below
 a) b)
a) b)
Solution
- Using Pythagoras rule
C2 = a2 + b2
a = 3, b = 4
c2 = 32 + 42 = 9 + 16
c2 = 25
c = 5m, the length of the third side is 5m.
- Using Pythagoras rule
c2 = a2 + b2
C = 13, a = a b = 5
132 = a2 + 52
a2 = 169 – 25 = 144
a =
a = 12cm
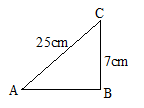 find the length of the third side of the triangle below:
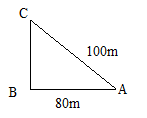
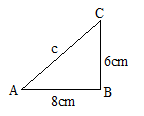
a) b) c)
Answer to the evaluations.
- /AC/2 = /AB/2 + /BC/2
AC = ?, AB = 8cm, BC = 6cm
AC2 = 82 + 62
AC = = 10cm
- /AC/2 = /AB/2– /BC/2
= 100m, = 80m, BC =?
1002 = 802 + /BC/2
1000 = 6400 + /BC/2 /BC/2 = 1000 – 6400
/BC/ = = 60M
- /AC/2 = /AB/2 + 72
AC = 25, /AB/ = 72
252 = /AB/2 + 49
/AB/2 = 625 – 49 = 576
/AB/ = = 24cm
Reference
NGM BK 2, chapter 17, pages 147 – 148
Essential mathematics for JSS BK 2, chapter 21, pages 215 – 218
USING PYTHAGORAS THEOREM TO SOLVE OTHER RELATED PROBLEM INVOLVING TRIANGLES
In some cases, we may have more than one right – angled triangle.
Worked examples
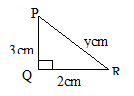
- Calculate the length of the unknown in the following triangle:
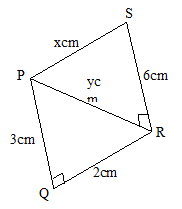
Solution
- PRS is right angled triangle, PQR is also a right angled triangle
Let PR be ycm
In triangle PQR; y2 = 32 + 22
= 9 + 4 = 13
y2 = 13
Let PS be xcm
In triangle PRS, x2 = y2 + 62
Substitute 13 for y2 in the formula
x2 = 13 + 62
x2 = 13 + 36
x2= = 7
PS = 7cm
- AD is the right angled ABD. Let AB be ycm.
In triangle ABC, x2 = y2 + (8 + 12)2
Substitute 225 for y2 in the formula
X2 = 225 + 202
= 225 + 400 = 625
X = = 25cm
Therefore, AD = 25cm
When solving triangle relating to decimal fraction and whole numbers, it is advisable to find the squares and square root from tables or multiplying the decimal by itself.
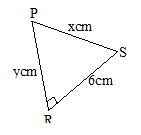
Evaluation
- A ladder is 7.3m long and the foot of the ladder is 1.8m from the wall. How far up the wall is the ladder?
- The distances between the opposite corner of a rectangular lawn is 30m, of the lawn is 24m. Calculate the breadth of the lawn.
GENERAL EVALUATION
- The distance between the opposite corners of a rectangular plot is 30m. The length of the plot is 24m. Calculate the breadth of the plot.
- A student cycles from home to school, first eastwards to a road junction 12km from home, then southwards to school. If the school is 19km from home, how far is it from the road junction?
REVISION QUESTION:
- A square top lid of a container has a diagonal 150cm. Find the length of one side of the lid.
- ABCD is a rectangle. AB = xcm, BC = 9cm and the diagonal AC = 19cm. Calculate the value of x.
READING ASSIGNMENT
Essential Mathematics for JSS 2 Chapter 21 pages 268 – 271
Exercise 21.1 1a – b, 2a – d, 3a – b, page 270
WEEKEND ASSIGNMENT
- The longest side of a right-angled triangle is called A. hypotenuse C. hypostasis C. base D. adjacent
- Calculate the length of the diagonal of a room 15m by 12m. A. 9m B. 81m C. 19m D. 12m
- Which of the following are Pythagorean triples? A. 6, 8. 10 B. 12, 28, 32 C. 9, 12, 20 D. 13, 15, 17
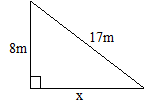
- Calculate the value of x in the diagram below.
A. 25m B. 15m C. 5m D. 11m
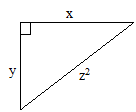
- In the diagram below, which of the following gives the value of side x2?
A. x2 = z2 + y2 B. x2 = z2 – y2 C. x2 = y2 – z2 D. x = z2 – y2
THEORY
- A flagpole 5m tall is supported by a wire that is fixe at point 3m from the base of the pole. Calculate to 1 d.p the length of the wire.
- A square top lid of a container has a diagonal of 150cm. Find the length of one side of the lid.


