Question 1
Part A
You are provided with the following:
- a voltmeter
- a resistance wire labelled P mounted on a metre rule
- a resistance wire labelled Q mounted on a piece of carton
- 2 dry cells at cell holder
- 6 connecting wires each with a crocodile clip at one end
Proceed as follows:
- Place the dry cells in series in the cell holder. Measure and record the total emf E of the cell.
E0 = 3.0 ± 0.2 V (1 mark)
2.8 to 3.2 V
(b) Connect the circuit as shown in figure 1.
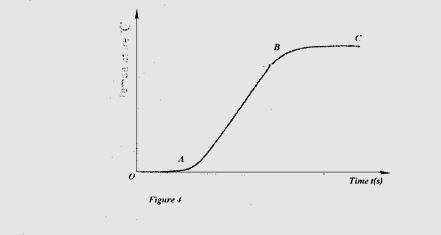
O is a point on P at the 50 cm mark of the metre rule. A and B are points on P such that:
- Adjust the positions of the crocodile clips A and B on P such that AO = OB = X – 2.5 cm; Close the switch. Read and record the potential difference (V) across AO in table 1.
- Repeat part (c) for other values of X shown in table 1 and complete the table.
- On the grid provided, plot a graph of — (y-axis) against (5 marks)
- Determine the slope S of the graph. (3 marks)
- Use the slope to determine the constant h, given that h = E0S (9 marks)
Part B
You are provided with the following:
- a soft drawing board
- a semicircular glass block
- three drawing pins
- a white paper
- a liquid labelled L
- a dropper
Proceed as follows:
- Place the white paper on the drawing board. Place the semicircular glass block on the paper and trace its outline using a pencil.
- At the centre of the straight edge of the outline mark a point O. Also mark a point X approximately at the centre of the curved edge of the outline as shown in figure 2.
- Place the semicircular glass block on the outline. Push a drawing pin vertically through O into the drawing board. Ensure the pin is in contact with the glass block. Using a dropper, place two or three drops of liquid L on the pin, so that the liquid flows down the pin forming a thin film between the pin and the vertical face of the glass block.
- View the image of the pin from point X through the glass block and move the eye around the curved surface to the right side of X until the image of the pin just disappears from view, (see figure 3).
Using a second pin locate and mark a point N on the curved outline at the point where the image just disappears.
- Repeat part (k) with the eye moving to the left side of X. Locate and mark the point M on the curved outline where the image just disappears from view.
- Draw the lines OM and ON on the outline.
- (i) Measure and record angle MON.
- (ii) If MON = 2A, determine θ given that sin A = 2q/3.
Question 2
Part A
You are provided with the following:
- a 100 ml glass beaker
- a weighing balance (to be shared)
- a liquid labelled L
- a measuring cylinder
Proceed as follows:
- Measure and record the mass M1 of the empty beaker.
- Measure and pour 2 ml of liquid L into the beaker. Measure and record the mass of the beaker + liquid L.
- Determine the density d of the liquid L (2 marks):
d =
Part B
You are provided with the following:
- a retort stand, boss and clamp
- 2 boiling tubes
- a thermometer
- some distilled water in a beaker labelled W
- some liquid in a beaker labelled L
- a large beaker containing some water
- a measuring cylinder
- a stopwatch
- a tripod stand and wire gauze
- a cardboard with a hole in the middle
- a burner
Proceed as follows:
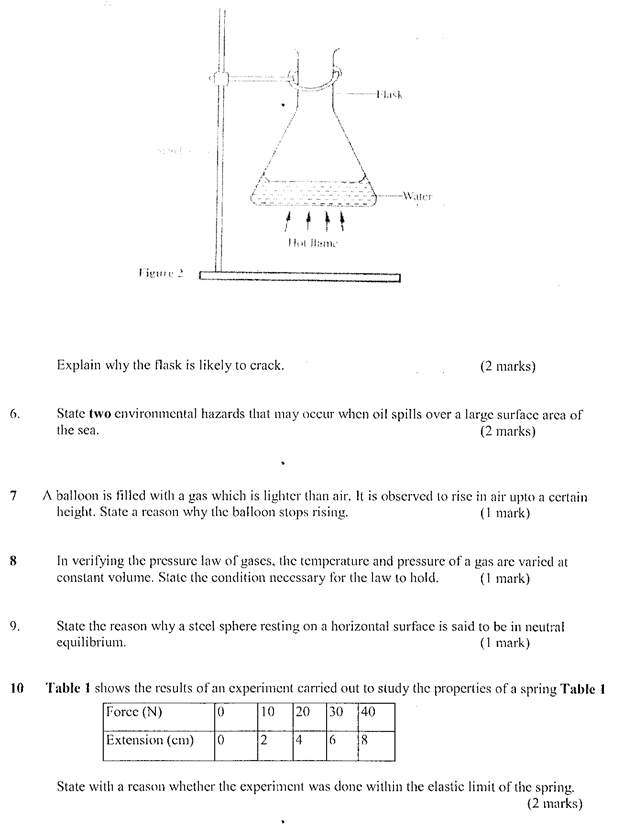
- Clamp one boiling tube on the retort stand. Measure and pour 45 ml of the distilled water (W) into the boiling tube. Set up the apparatus as shown in figure 4.
- Heat the water in the large beaker until the temperature of the distilled water reaches 85°C. Remove the boiling tube from the hot water by lifting up the retort stand and placing it away from the burner.
- Stir the water in the boiling tube using the thermometer. Record in table 2 the temperature of the distilled water at intervals of 30 seconds starting at 80°C until it drops to 60°C. (Stir the distilled water before taking any reading).
- Using the second boiling tube, repeat the procedure in (d), (e), and (f) using 45 ml of liquid L instead of distilled water. Record your results in the same table.
- Using the same axes on the grid provided, plot a graph of temperature (y-axis) against time for:
- distilled water W
- liquid L
(Label the graphs of L and W).
- From the graphs determine (1 mark):
(i) the time t taken for the distilled water to cool from 75°C to 65°C.
tw = minutes
(ii) The time t taken for liquid L to cool from 75°C to 65°C.
tL = minutes
both times to come from candidate work/graph within
- Determine the constant r given that r = 4.2 tL where d is the density of the liquid L in part (A). (2 marks)
- Correct substitution in right = 1 mark
- Correct evaluation to 1 d.p.

 11. Figure 3. Shows a graph of velocity against time for a moving body
20
velocity
0 5 10 Time (s)
Figure 3