ECOLOGY
Ecology is the scientific study of the relationship of organisms with their natural surroundings.
OR
- The study of relationships of living organisms to each other and their surrounding physical environment.
Importance of Studying Ecology
- Provides a scientific foundation for understanding fields such as agriculture, forestry, fishery, and animal husbandry.
- Helps predict and remedy environmental degradation and promotes conservation efforts.
- Assists in understanding the consequences of large-scale environmental interventions like dam construction and deforestation.
- Is an interdisciplinary science linking physical, biological, and social sciences.
- Raises public awareness on environmental issues, leading to laws, political movements, environmental consultancies, and data services.
Definition of Terms
- Environment – Refers to the surroundings of organisms.
- Everything that surrounds an organism and influences it.
- Population – A group of organisms of one species occupying a defined area or habitat at the same time.
Community – Any group of organisms belonging to different species that coexist in a habitat and interact through trophic and spatial relationships. - Ecosystem – A community of organisms and their physical environment interacting as an ecological unit.
- Habitat – The typical environment of a particular organism, population, or community.
OR
An area occupied by a particular organism, population, or community. - Biosphere – The total volume of the earth in which life permanently exists.
Approaches to Ecology
A proper understanding of ecology requires simultaneous consideration of all factors interacting in a particular place. Ecologists adopt one of several main approaches when undertaking investigations. Five approaches can be identified:
- Ecosystem Approach: Focuses on the flow of energy and cycling of matter between living and non-living components.
- Community Approach: Focuses on the biotic components, identifying and describing species and factors controlling their presence. Also called synecological approach.
- Population Approach: Focuses on individual species in relation to their environment.
- Habitat Approach: Describes the typical environment of an organism, population, community, or ecosystem.
- Evolutionary and Historical Approach: Focuses on changes in organisms over time and development of human technology and culture.
THE ECOSYSTEM
- The ecosystem refers to a community of organisms and their physical environment interacting as an ecological unit.
- It describes the complex of organisms living together as a sociological unit and its habitat.
Components of the Ecosystem
- The ecosystem is made up of living (biotic) and non-living (abiotic) components.
- Biotic components include plants, animals, and microorganisms.
- Abiotic components include soil, water, and climate.
Soil and water contain a mixture of inorganic and organic nutrients. Climate includes environmental variables such as light, air, water, and temperature.
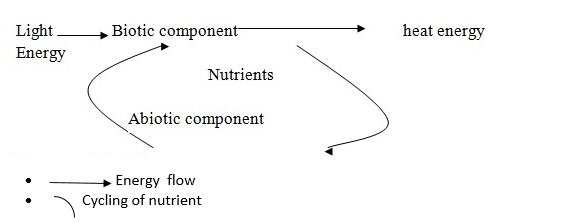
ENERGY FLOW AND NUTRIENT CYCLING
Ecological studies focus on how connections between organisms and their abiotic environment work. Energy flow and biochemical cycling are important functional links that maintain ecosystem stability and sustainability.
Energy is defined as the capacity to do work. Living organisms require energy to stay alive. The ultimate source of energy in ecosystems is the sun, which autotrophs capture via photosynthesis, converting solar energy into chemical energy.
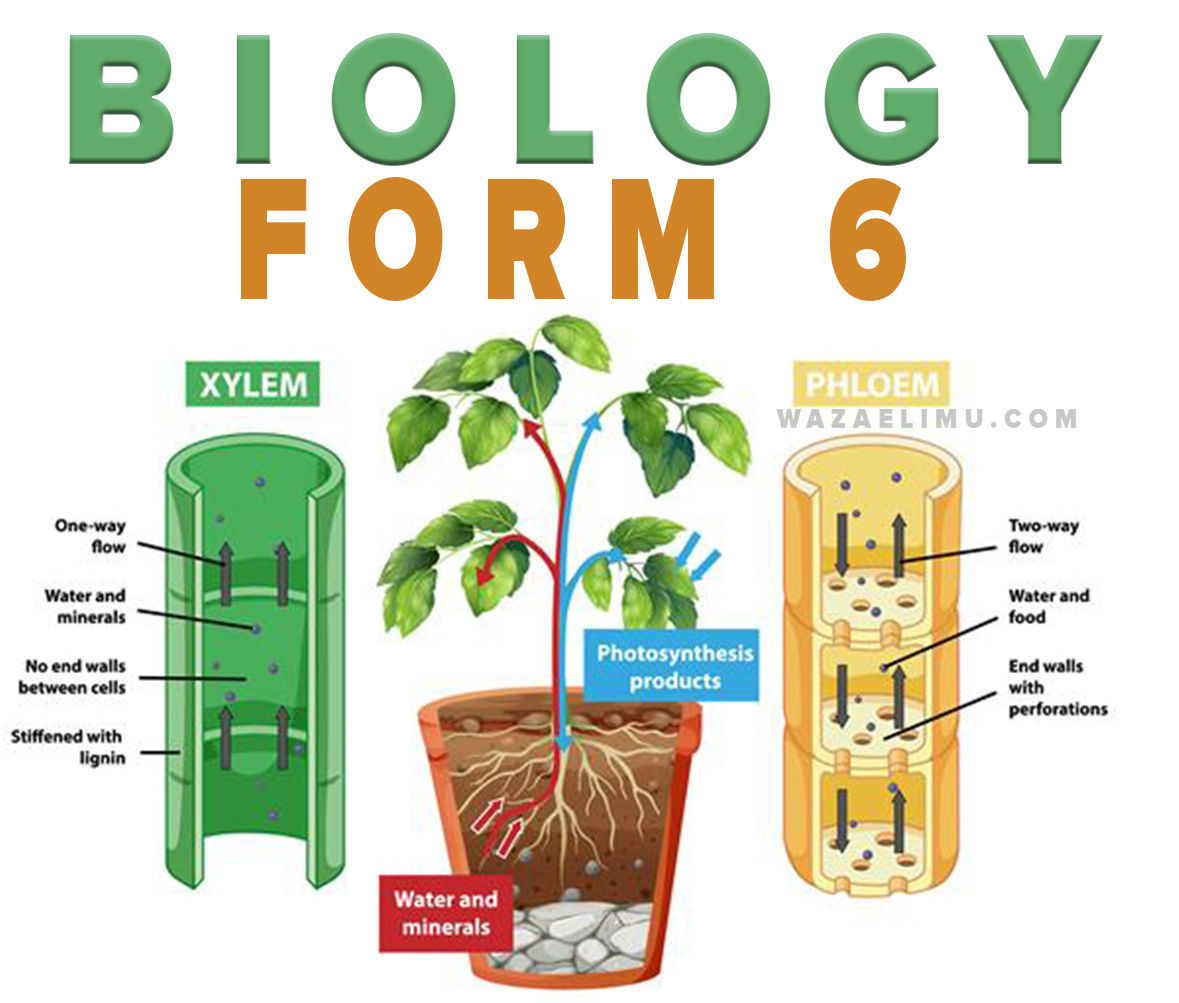
Energy passes from photosynthetic organisms to others through feeding relationships, known as energy flow. Energy flow is one-way because energy is lost as heat and cannot be recycled.
BIOCHEMICAL CYCLING (Cycling of Matter)
Chemicals in living organisms originate from abiotic components like soil, water, and air, and return to these through decomposition. Bacteria and fungi decompose dead matter, obtaining energy in the process. Biochemical cycling involves the constant cycling of chemical materials within the ecosystem, involving both living and non-living parts.
Energy flow and nutrient cycling maintain ecosystem stability.
ENERGY TRANSFER
The concepts of food chain, trophic levels, and food web explain energy transfer. Autotrophic organisms produce energy-containing organic molecules, which serve as food for heterotrophs. Energy is transferred through a series of organisms via feeding relationships.
FOOD CHAIN
A food chain is a series of organisms each feeding on the preceding one, providing raw materials and energy for the next. Each food chain starts with producers.
- Producers – autotrophic organisms that synthesize food using sunlight energy and are eaten by other organisms.
Based on food relations, biotic components of the ecosystem are categorized as:
- Producers: Autotrophs that synthesize food using sunlight energy, including green plants, algae, protoctists, and phototrophic bacteria. Major aquatic producers are algae forming phytoplankton; on land, producers include angiosperms and conifers forming forests and grasslands.
- Consumers: Heterotrophs that obtain energy from producers directly or indirectly. Categories include:
- Primary consumers: Feed on producers; herbivores such as insects, reptiles, birds, and mammals on land; small crustaceans and molluscs in aquatic ecosystems.
- Secondary consumers: Feed on herbivores; carnivores like wolves and snakes.
- Tertiary consumers: Feed on secondary consumers; carnivores like lions, tigers, and hawks.
Note: Secondary and tertiary consumers may be predators (hunt and kill prey), carrion feeders (feed on corpses), or parasites (smaller than their hosts).
DECOMPOSERS AND DETRITIVORES
Decomposers are microorganisms, mainly fungi and bacteria, that live as saprophytes and feed on dead organic matter by secreting digestive enzymes and absorbing the products. Detrivores are organisms that feed on small fragments of decayed or dead material (detritus), contributing to decomposition. Examples include earthworms. Decomposers and detrivores form their own food chain.
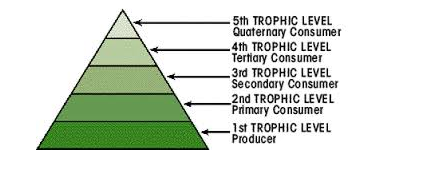
TROPHIC LEVEL
Trophic levels are the stages of a food chain. Each group of organisms in a food chain forms a trophic level (trophos – feeding). Energy flows one way through trophic levels. Usually, there are four or five trophic levels, seldom more than six, because energy decreases at each level, limiting support for organisms.
- First trophic level: producers (autotrophs).
- Second trophic level: herbivores.
- Third trophic level: secondary consumers (carnivores).
- Fourth trophic level: tertiary consumers (carnivores).
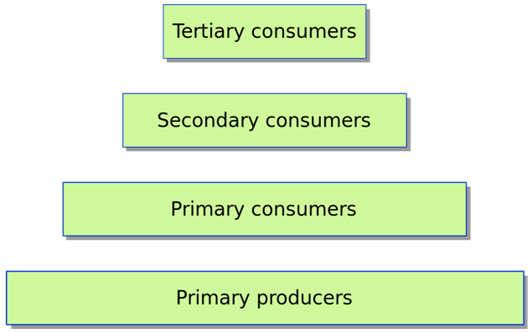
ECOLOGICAL PYRAMIDS
Feeding relationships and energy transfer through the biotic components of ecosystems can be quantified and shown diagrammatically as ecological pyramids. These illustrate changes within a system and are used for quantitative comparison of ecosystems worldwide.
Pyramids of Numbers
In ecosystems, smaller organisms usually outnumber larger ones. A pyramid of numbers shows the number of organisms at each trophic level and how they change in successive levels. Organisms are counted and grouped by trophic level, showing a progressive decrease in numbers at higher levels. Plants often outnumber animals, depending on organism size.
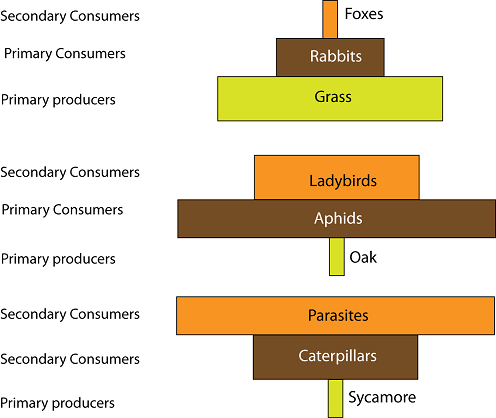
Types of Pyramid of Numbers
Pyramid of Biomass
This pyramid considers the total mass (biomass) of organisms at each trophic level, ideally using dry mass estimated by weighing representative individuals. The rectangle size is proportional to biomass at each level at the time of sampling (standing crop mass).
Drawbacks:
- More laborious and expensive in terms of time and equipment.
- Does not account for seasonal changes in biomass (e.g., deciduous trees have more biomass in summer than winter).
- Does not consider the rate of biomass accumulation; mature trees have large biomass but slow growth.
Inverted pyramids of biomass occur in aquatic ecosystems starting with phytoplankton, which have rapid turnover compared to their predators. The pyramid can bulge in the middle. They do not show productivity (rate of material and energy transfer).
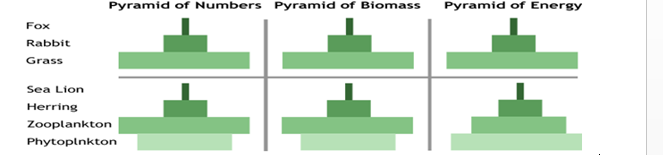
Pyramid of Energy
These pyramids are based on the amount of energy at each trophic level, showing how much energy passes from one level to the next. The length of the producer bar is proportional to solar energy captured annually. Other bars show energy transfer rates. Unlike pyramids of numbers and biomass, energy pyramids account for production rates.
Note: Energy transfer from producers to primary consumers is less efficient (~10%) than between animals (~20%). Energy decreases from lower to higher trophic levels due to:
- Energy used for metabolic activities (respiration).
- Energy lost as heat during respiration.
- Energy locked in indigestible parts (bones, horns, cellulose).
- Incomplete assimilation of food.
- Insufficient harvesting of food by consumers.
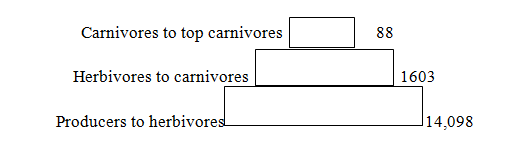
Carnivores to top carnivores: 88
Herbivores to carnivores: 1603
Producers to herbivores: 14,098
Pyramid of energy for Silver Springs, Florida (energy flow in KJ m-2 yr-1)
Usefulness of Pyramid of Energy
- Accounts for rate of production, unlike pyramids of numbers and biomass.
- Allows comparison of different ecosystems and relative importance of populations.
- Shows energy required to support each trophic level.
- Energy pyramids are never inverted or have central bulges.
- More informative than pyramids of numbers and biomass.
- Solar energy input can be added as an extra rectangle at the base.
Disadvantages of Ecological Pyramid of Energy
- Data collection is difficult.
- Not always accurate in representing ecosystem energy content.
General Criticisms of Ecological Pyramids
- Assigning organisms to trophic levels is sometimes ambiguous, especially for carnivores and omnivores with varied diets.
- Dead material (detritus) and waste are hard to fit into conventional pyramids despite their importance as food sources.
BIOCHEMICAL CYCLES – The Cycling of Matter
Chemicals in living organisms originate from abiotic components like soil, water, and air, and return to these through decomposition of waste and dead organisms. Bacteria and fungi decompose organic matter, obtaining energy in the process. Biochemical cycling involves constant cycling of chemical materials within the ecosystem, involving both living and non-living parts.
Chemicals are recycled, but energy flows through the ecosystem and is lost as heat, so energy is not recycled. Frequent solar energy input is necessary to maintain ecosystems.
Important biogeochemical cycles include carbon (C), nitrogen (N), sulfur (S), and phosphorus (P), which are major macronutrients.
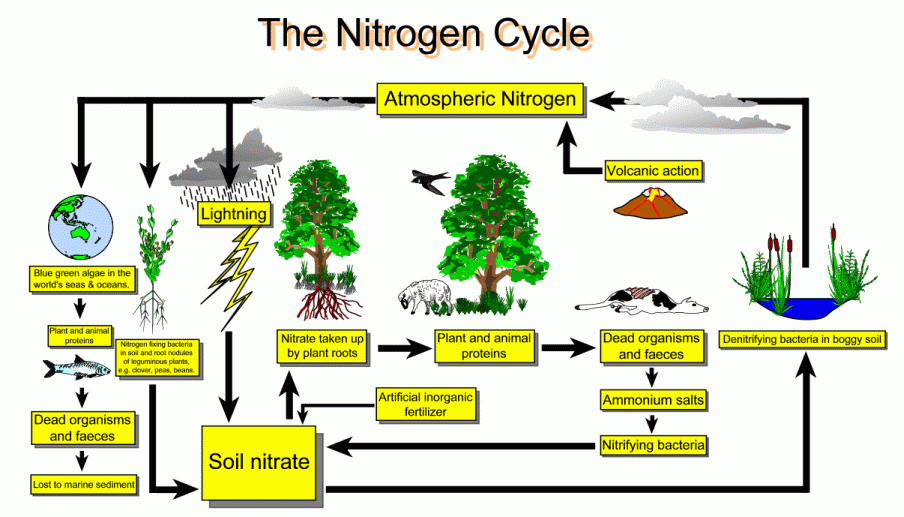
NITROGEN CYCLE
Nitrogen makes up about 78% of the atmosphere but few organisms use gaseous nitrogen directly. Plants depend on soil minerals, especially nitrates, for nitrogen. Nitrogen deficiency limits plant growth, so nitrogen is commonly applied as fertilizer.
The nitrogen cycle includes:
- Nitrogen Fixation: Conversion of atmospheric nitrogen (N2) into nitrates, ammonia, or ammonium compounds by:
- Biological fixation: Nitrogen-fixing bacteria (Azotobacter, Clostridium), cyanobacteria, and Rhizobium in legume root nodules convert N2 to ammonia (NH3).
- Electrochemical and photochemical fixation: Lightning and cosmic radiation convert N2 to nitrate (NO3) in the atmosphere.
- Industrial fixation: Chemical fertilizer industries convert N2 to nitrates for fertilizers.
- Nitrification: Conversion of ammonia (NH3) in soil to nitrates by nitrifying bacteria in two steps:
- Ammonia to nitrite (NO2–) by Nitrosomonas.
- Nitrite to nitrate (NO3–) by Nitrobacter and Nitrococcus.
Humans contribute significantly to the nitrogen cycle by producing fertilizers.
- Decomposition: Microorganisms like Actinomycetes, fungi, and ammonifying bacteria convert waste and dead bodies to ammonia.
- Denitrification: Denitrifying bacteria (Pseudomonas, Thiobacillus) convert nitrates back to nitrogen gas, balancing nitrogen fixation but not completely.
CARBON CYCLE
Carbon is a basic building block of all living things, essential in carbohydrates, fats, and proteins. It is present in the atmosphere as carbon dioxide (CO2) and enters ecosystems through producers.
Organisms exchange CO2 via photosynthesis and respiration. In aquatic ecosystems, CO2 exchange is indirect, involving carbonic acid and bicarbonate ions (HCO3–), which algae use for photosynthesis.
When plants and animals die, decomposers break down organic matter, releasing carbon to the soil for plant absorption. Some organic matter forms fossil fuels (coal, oil) over millions of years. Burning fossil fuels increases atmospheric CO2.
Reservoirs of Carbon
- Oceans and seas store carbon as bicarbonate ions, used by marine organisms to build shells.
- Living and dead organisms contain organic carbon.
- Fossil fuels formed from ancient organic matter.
- Calcium carbonate in limestone and shells.
Influence of Humans on Carbon Cycle
- Burning fossil fuels releases CO2 and other gases.
- Burning fuelwood (firewood, charcoal).
- Deforestation reduces photosynthetic biomass and CO2 consumption.
- Removal of tree canopy increases decomposition rates and CO2 release.
ECOLOGICAL NICHE
Ecological niche refers to the physical space and functional role of a group of organisms.
- The niche is the organism’s role or profession in a community (producer, consumer, predator, scavenger, decomposer).
- It is the place occupied and how the organism uses ecosystem resources.
- It includes relations to food, enemies, habits, and biological factors.
No two species can have the exact same niche; overlap leads to competition until one is displaced.
Similar habitats worldwide may have similar niches but different species (e.g., fast-running herbivores in grasslands).
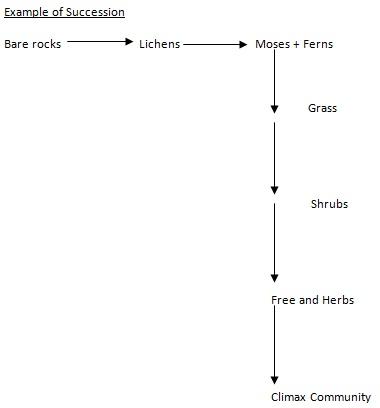
ECOLOGICAL SUCCESSION
Formation of a community: A group of organisms of different populations coexisting in the same habitat.
- Community ecology studies development and stability of communities.
- Communities develop over time and are dynamic units.
- Stable communities establish through orderly stages called ecological succession.
- A complete succession is called a sere, made up of several stages.
- A stable community is called a climax community.
Types of Ecological Succession:
- Primary succession: Community established where none existed before (e.g., sand dunes, volcanic lava flows).
- Secondary succession: Occurs where a community was disrupted and vegetation removed (e.g., after earthquakes, fires, or deforestation).
METHODS OF STUDYING ECOLOGY
Sampling Technique: Method of establishing a sample, a subset of items taken from a larger group to provide information about the whole.
Types of sampling:
- Random sampling: Every item has an equal chance of inclusion.
- Systematic sampling: Selection of every nth item in a list, with randomness introduced by random starting point.
- Stratified sampling: Population divided into subpopulations that are more homogeneous than the total population.
Sample size: Number of items selected from the population to constitute a sample.
ADVANTAGES OF SAMPLING
- Makes study easier by involving fewer organisms.
- Saves time and reduces financial cost compared to studying entire populations.
Sampling methods include:
- Transects
- Quadrats
- Point frame
- Pitfall traps
- Box trapping
Ways of establishing a sample:
- Line transect: Tape or string run in a straight line between two points.
- Belt transect: Strip of chosen width between two line transects.
- Quadrat: Metal or wooden frame forming a square of known area (e.g., 0.25 m2 or 1 m2).
Quadrat usage methods:
- Random throw
- Used with line transects
Other types of quadrats:
- Pin frame (point quadrat): Frame with holes through which pins are passed.
- Permanent quadrat: Used for long-term ecological studies.
Other methods:
- Computer programs
- Direct observation
- Photographs
- Pitfall traps
- Box trapping
Capture-Recapture Method
Involves capturing organisms, marking them without harm, releasing them, then recapturing to estimate population size using the formula:
Total population = (original number tagged × total recaptured) ÷ number of tagged in recapture
Example 1: 50 animals tagged and released; later 220 caught with 35 tagged. Estimate population:
50 × 220 ÷ 35 = 314.28
Example 2: 100 deer tagged and released; later 90 caught with 12 tagged. Estimate population:
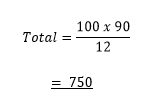
Quadrats, direct observation, and photography are direct counting methods; capture-recapture is an indirect method.
Sampling methods help calculate species distribution aspects:
- Species density: Number of individuals per unit area (e.g., 10 per m2).
- Species frequency: Probability of finding a species in a quadrat (e.g., 10% if found once in 10 quadrats).
- Species cover: Proportion of ground occupied by a species as a percentage of total area.
Capture Method by Removal
Number of animals captured is recorded and kept; repeated samples show decreasing numbers. A graph of number captured vs. cumulative captures is plotted to estimate total population when no further captures occur.
| Sample | No. in sample | Cumulative sample size |
|---|---|---|
| 1. | 120 | 0 |
| 2. | 93 | 120 |
| 3. | 60 | 213 |
Population Dynamics
A population is a group of organisms of the same species occupying a particular area, usually isolated by geographical factors. Population studies include growth, maintenance, and decline.
Population dynamics is the study of how and why population size changes over time, examining density, birth rate (natality), survival, age structure, migration, and growth form.
Population size refers to the number of individuals in a population.
Factors affecting population size:
- Birth rate (natality rate)
- Mortality rate
- Migration
Population size increases due to immigration and reproduction; decreases due to emigration and death.
Birth rate is the number of young produced per female per unit time.
Mortality is the rate of death, expressed as percent or per thousand per year.
Population growth refers to increase in population, which can decline in characteristic ways.
Factors affecting population growth:
- Reproductive potential: rate of reproduction given unlimited resources.
- Environmental resistance: sum of biotic and abiotic limiting factors preventing maximum reproduction, including predation, food supply, heat, light, space, competition, and behavioral adaptations.
Population growth changes due to birth or death rate changes. Food shortage and predation affect mortality.
Birth rate is regulated by:
- Territorial behavior
- Physical effects of overcrowding
Territories are areas defended by individuals, excluding others of the same species, used for feeding, mating, and rearing young. Territorial animals benefit from exclusive access to resources and protection from predators.
Overcrowding reduces birth rate through hormonal changes causing infertility, abortion, and reduced parental care.
Interspecific interactions occur between populations of different species, including predator-prey and host-parasite relationships.
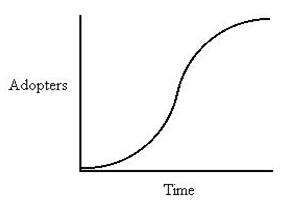
Population growth curves:
- J-shaped growth curve: Exponential growth until sudden environmental resistance causes abrupt stop.
- S-shaped (sigmoid) growth curve: Slow initial growth, rapid increase, then slowing to zero growth as birth and death rates equalize due to competition.
BIOMES
A biome is a large region in the biosphere with characteristic physical conditions supporting organisms adapted to those conditions.
Alternatively, a biome is a collection of similar ecosystems in a region, such as deserts, forests, grasslands, or aquatic zones like oceans and lakes.
Biomes are the largest terrestrial ecological units, characterized by specific plants and animals influenced by climate (rainfall, temperature, light).
Examples of terrestrial biomes:
- Tundra
- Northern coniferous forest (Taiga)
- Deciduous forest
- Mediterranean shrub
- Tropical savannah
- Grassland
- Desert
Biomes involving aquatic ecosystems:
- Marine environment
- Freshwater environment
Human population is the most abundant (~7 billion), widely distributed across climates, differing economically, socially, culturally, and physically.
Demography studies human population growth trends, age groups, education, training, and employment.
Factors Affecting Human Population Patterns
- Climatic and edaphic factors: Extreme heat (deserts) and cold (Arctic, Antarctica) are less populated.
- Location of natural resources
- Transport facilities
- Industrial development and education
- Birth and death rates vary by country and region.
- Urban areas face overcrowding and environmental issues.
POPULATION EXPLOSION AND CONSEQUENCES
Human population has grown exponentially, doubling three times in the last three centuries, reaching 6 billion and projected to reach 8 billion by 2020.
Growth is due to improved health and technology reducing death rates. Concerns exist about Earth’s carrying capacity and environmental damage.
HUMAN IMPACT ON ECOSYSTEM
Since agriculture and technological development, human impact on the environment has increased, especially due to industrialization causing pollution.
POLLUTION
- Release of substances or energy into the environment causing harm to organisms or their surroundings.
- Harmful substances are called pollutants and degrade environmental quality.
Examples of pollutants:
- Agricultural chemicals (fertilizers, pesticides, herbicides)
- Industrial emissions (sulfur dioxide, mercury, carbon monoxide, CFCs, lead, cadmium)
- Sewage
- Smog
- Oils
- Radiations (gamma rays, X-rays)
- Dust
CONSERVATION
Natural resources are materials from the environment that humans use.
Types:
- Renewable resources: Can be replaced quickly (e.g., water, wildlife, forests).
- Non-renewable resources: Cannot be replaced quickly (e.g., fossil fuels, minerals).
Conservation is retaining the status quo through careful management to preserve species, habitats, and ecosystems from harmful human influence, avoiding decline, extinction, and environmental degradation.
Reasons for conservation:
- Maintain world ecosystems (terrestrial, aquatic, aerial habitats).
- Ethical reasons: cultural, traditional, religious, and political beliefs shape attitudes toward nature.
- All species have a right to coexist; humans should not cause extinction or diminish life quality.
- Custodianship: pass biodiversity and environment quality to future generations.
- Aesthetic reasons: humans derive pleasure from a pleasant environment and biodiversity.
- Local, national, and international organizations promote wildlife and resource conservation.
- Fisheries provide direct food sources.
- Agriculture requires conservation of food stocks and soil quality.
- Use of pollinating insects and beneficial predators in pest control.
- Maintain balanced biochemical cycles and regulate climate.
- Prevent deforestation and desertification.
- Reduce soil erosion and sedimentation in rivers.
- Retain biodiversity and gene pools.
- Preserve rare species with genetic potential.
- Minimize effects of mining, drilling, and urbanization.
Measures for sustainable resource use:
- Educate people on environmental importance.
- Encourage tree planting.
- Promote organic manure and good agricultural practices (terrace farming, crop rotation).
- Discourage harmful practices like slash-and-burn farming.
- Enforce legislation protecting national parks, grasslands, and endangered species.
- Regulate animal populations to prevent overpopulation.
- Reduce pollution by using lead-free petrol, alternative energy, biodegradable products, and recycling.
- Increase biodiversity through botanical gardens, seed banks, and gene banks.
- Promote sustainability by conserving resources for future generations.
WASTE MANAGEMENT
- Avoid excessive use of chemicals like pesticides and herbicides.
- Encourage biological control.
BIOLOGICAL CONTROL
Artificial control of pests and parasites competing with humans for food or damaging health, using organisms or their products based on predator-prey relationships. Control agents feed on pests (e.g., ladybirds on aphids, caterpillar larvae parasitized by Bacillus species) or cause diseases (e.g., virus sprays on armyworm caterpillars).
Aim: Reduce pest populations to tolerable levels, not eradicate them.
Advantages
- Does not pollute the environment.
- Easy to apply without sophisticated machinery.
- Effective over generations; pests do not develop resistance.
- Selective feeding on intended pests.
- Cost-effective.
Disadvantages
- Beneficial organisms may be eliminated if food is scarce, disrupting food chains.
- Predators may become pests by feeding on non-target organisms.
- Expensive and time-consuming to study pest and predator biology.
- Predators may fail to survive in new environments.
- Biological control may be slow to react to high pest outbreaks, allowing damage to continue.


14 Comments