
NATIONAL INCOME
Definition: National income is the total flow of income obtained by individuals in an economy within a year.
OR
– It is the total value of all the expenditure by different people and government within an economy over a period of one year.
OR
– It is the value of final goods and services produced by a given country within a year.
NATIONAL INCOME ACCOUNTING / MEASURES OF NATIONAL INCOME
National income measures are used to estimate the value of goods and services produced in an economy.
The following components are used in the calculation of national income:
Gross Domestic Product (GDP)
The most important concept of national income is Gross Domestic Product. Gross Domestic Product is the money value of all final goods and services produced within the domestic territory of a country during a year.
Algebraic expression under product method is,
GDP = Σ (P × Q)
where,
- GDP = Gross Domestic Product
- P = Price of goods and services
- Q = Quantity of goods and services
- Σ denotes the summation of all values.
Gross National Product (GNP)
Gross National Product is the total market value of all final goods and services produced annually in a country plus net factor income from abroad. Thus, GNP is the total measure of the flow of goods and services at market value resulting from current production during a year in a country including net factor income from abroad. The GNP can be expressed as the following equation:
GNP = GDP + NFIA (Net Factor Income from Abroad)
or, GNP = C + I + G + (X – M) + NFIA
Hence, GNP includes the following:
- Consumer goods and services.
- Gross private domestic investment in capital goods.
- Government expenditure.
- Net exports (exports – imports).
- Net factor income from abroad.
Net National Product (NNP)
Net National Product is the market value of all final goods and services after allowing for depreciation. It is also called National Income at market price. When charges for depreciation are deducted from the gross national product, we get it. Thus,
NNP = GNP – Depreciation
or, NNP = C + I + G + (X – M) + NFIA – Depreciation
National Income (NI)
National Income is also known as National Income at factor cost. National income at factor cost means the sum of all incomes earned by resource suppliers for their contribution of land, labor, capital, and organizational ability which go into the year’s net production. Hence, the sum of the income received by factors of production in the form of rent, wages, interest, and profit is called National Income. Symbolically,
NI = NNP + Subsidies – Indirect Taxes
or, NI = GNP – Depreciation + Subsidies – Indirect Taxes
or, NI = C + G + I + (X – M) + NFIA – Depreciation – Indirect Taxes + Subsidies
Personal Income (PI)
Personal Income is the total money income received by individuals and households of a country from all possible sources before direct taxes. Therefore, personal income can be expressed as follows:
PI = NI – Corporate Income Taxes – Undistributed Corporate Profits – Social Security Contribution + Transfer Payments
Disposable Personal Income (DPI)
DPI = PI – Direct Taxes – Fines – Fees = Consumption + Saving


Equate (i) and (ii):
C + I = C + S
I = S
Where:
- I = Investment
- S = Saving
- C = Consumption
Qn 1: Given national income at market price is 100,000,000, indirect taxes 10,000,000 and subsidy 5,000,000. Calculate national income at factor cost.
Solution:
NI = NNP – Indirect taxes + Subsidy
= 100,000,000 – 10,000,000 + 5,000,000
= 90,000,000 + 5,000,000
= 95,000,000/=
Qn 2: Given a hypothetical economy of country X where GNP is 400,000,000, consumption of capital 4 million, outflow of goods and services 120 million, inflow of goods and services 180 million, taxes 5 million, subsidies 30 million. Calculate net factor income from abroad = GNP – GDP.
METHODS OF CALCULATING NATIONAL INCOME
1. OUTPUT APPROACH / PRODUCT METHOD
This method adds all the sectors’ value of output in an economy. The output approach measures the value of an economy at the source of production. It sums the value of output from sectors like mining, wildlife, manufacturing, etc.
In output approach, the value added by all firms in different stages of production can be added to get national income.
Example:
Suppose we have a maize producer who sells maize to a miller at TSHS 1500 per kilogram. The miller changes the maize into flour and sells it to traders at TSHS 1000. Traders sell to the final consumer at TSH 2100. To get the income using the value-added method we add:
- Maize: 1500
- Value of flour: 400
- Value


2. EXPENDITURE APPROACH
This method adds the value of spending on all final goods and services to get the value of national income.
Expenditure = E = C + G + I + (X – M)
Where:
- C – Personal consumption expenditure
- G – Expenditure by the government
- I – Expenditure on investment
- X – Expenditure on exports by buyers
- M – Expenditure on imports
Note: (X – M) gives net export.
GDP = C + I + G + (X – M)
GNP = GDP + Net foreign income
= C + I + G + (X – M) + NFI
3. INCOME APPROACH
This method adds all incomes received by factors of production. They include wages, profit, interest, and rent.
GDP = Wages + Profit + Rent + Interest + Operating Surplus.
CIRCULAR FLOW OF NATIONAL INCOME
Qn: What is circular flow of national income?
Given a simple closed economy with mainly two sectors, i.e., household and firm (business), the flow of income can be illustrated as follows.
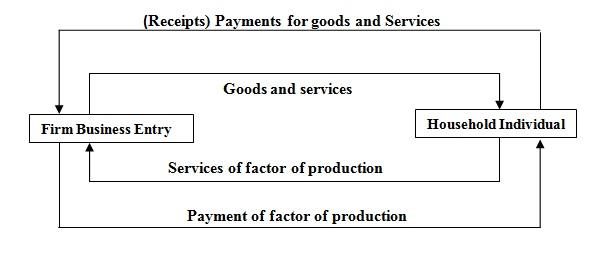
Assumptions in the above economy:
- It is a closed economy, i.e., there is no foreign trade.
- There are no leakages; every income received must be spent, e.g., saving, taxes, imports.
- The economy has two sectors, namely household and firm.
- The household provides factors of production to firms and spends all the income it receives in purchase of goods and services.
- It assumes there are no injections, i.e., there is no income arising from expenditure outside the economy, e.g., investment, government expenditure, exports.
Each time something is produced and sold, its value is equal to the purchaser’s expenditure. The purchaser’s expenditure will be received as income by those who produced. Hence E = O = Y. National expenditure is equivalent to national output, equivalent to national income.
THE DETERMINANTS OF THE SIZE OF NATIONAL INCOME
- Availability of resources and their utilization
These resources include natural resources, man-made and human resources; the more the resources utilized, the more the income.
- Political and social stability
- The availability of entrepreneurial force in the economy
- The size of capital accumulated by a country
The more the capital goods, the more the national income due to investment.
- The level of technology
Advancement of technology leads to higher production leading to a higher national income.
- Government policy
This is particularly in developing policies such as infrastructure policy, privatization, licensing, etc. The more complicated the government policy, the fewer the entrepreneurs, the lesser the output, and hence the lower the national income.
- The efficiency of labor force
The more inefficient the labor, the lesser the quality and output affecting the size of national income.
USES OF NATIONAL INCOME STATISTICS
- National income statistics help to show the growth rate of an economy annually, i.e., the government computes the national income and compares it with other years and calculates the % growth rate.
- National income statistics help to get per capita income.
Per capita income = National Income / Population
- It is used to determine the effectiveness of the government in tax revenue collection. The tax revenue collected should be proportional to the national income.
- It helps to indicate resource utilization, i.e., the more the national income, the more the utilization of resources.
- It is used for international comparison of economic growth and the performance of a country.
- It is used for attracting foreign donors.
- It helps the government in making decisions on allocation of resources in different sectors by assessing the contribution in national income. The best sector is considered in resource allocation.
- It is used by the government in making policies, e.g., policies on employment, etc.
PROBLEMS ENCOUNTERED IN COMPILING NATIONAL INCOME STATISTICS
- Inaccurate data makes it difficult to get correct figures of national income and per capita income.
- Transfer payments are used in calculating personal income; it is difficult to know their actual value, e.g., the value of a gift.
- There is sometimes a problem of double counting. Some items are included more than once in calculating national income, e.g., work in progress.
- There is a shortage of qualified personnel in compiling data.
- Subsistence economy (non-monetary activities).
- Illegal activities, i.e., black market, social evils.
- There is a problem of estimating income received from abroad.
- Data from self-employment activities is not easily available.
KEYNESIAN APPROACH IN THE DETERMINATION OF NATIONAL INCOME EQUILIBRIUM
According to Keynes, national income equilibrium is determined at the intersection of demand and supply. In this argument, he stated the following assumptions:
- Keynes assumed that there are only two sectors in an economy, i.e., household and firm.
- The prices of products are constant.
- He assumed that there is no government expenditure.
- Keynes assumed that the supply of labor is constant.
Demand, according to Keynes, is the total expenditure by society. It is obtained from consumption and investment, i.e., total demand is equal to total expenditure = C + I.
Hence, Y = C + I
Supply is the total goods and services produced in a country within a year. According to Keynes, supply = consumption + saving because when goods and services are sold, the income received is spent on consumption and saving.
Hence total supply = C + S
DD = SS
Y = C + I and Y = C + S
C + I = C + S
I = S
Hence, according to Keynes, equilibrium in the national income is obtained when investment (I) is equal to saving (S).
RELATIONSHIP BETWEEN CONSUMPTION AND INCOME
CONSUMPTION: Is the total expenditure by households which gives satisfaction.
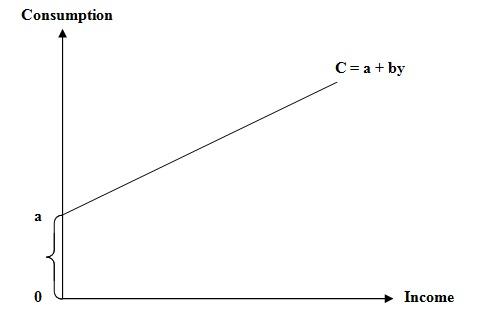
CONSUMPTION FUNCTION
Is a mathematical relationship between consumption and the level of disposable income. It is denoted by:
C = a + by
Where:
- c is consumption
- a is autonomous consumption. This is consumption that does not depend on income. It comes from past savings and borrowing.
- b is induced consumption, i.e., consumption that depends on income and changes with change in income. This is the proportion of the income spent on consumption. It is also called marginal propensity to consume (MPC). It is the slope of the consumption function.
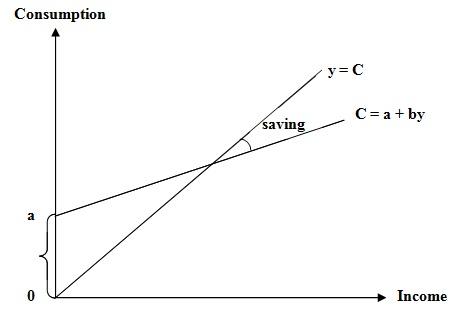
The consumption function can be illustrated graphically as follows:
Average Propensity to Consume (APC)
This is consumption per unit of income, i.e., it is total consumption divided by total income.
![]()
Marginal Propensity to Consume (MPC)
Is the additional consumption resulting from additional income.
![]()
FACTORS AFFECTING/DETERMINING THE LEVEL OF CONSUMPTION
- The level of income (disposable income)
- Government expenditure
The higher the government expenditure, the higher the consumption.
- The more the taxes, the lesser amount spent for consumption.
- Prices of goods and services.
The higher the prices of goods and services, the lesser the level of consumption.
- Amount of undistributed profits.
The more the profit retained, the less the income, the lower the consumption.
- Changes in interest rate
Low interest rate on loans and savings increases consumption, and high interest rate on loans and savings decreases consumption.
- Population size.
Level of consumption depends on the level of population. When the population is higher, the consumption is also higher and vice versa.
RELATIONSHIP BETWEEN SAVING AND INCOME
Saving: Refers to that part of income which is not spent in the current period.
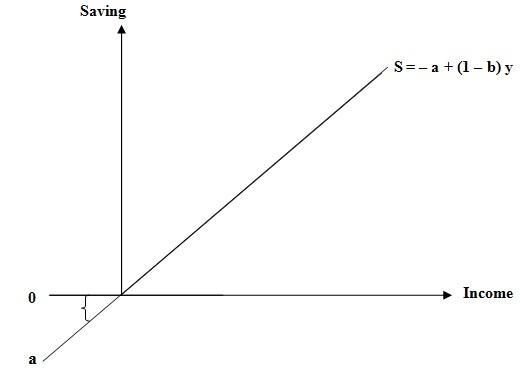
Saving function
Is a mathematical relationship between saving and income.
Qn: Derive the saving function.
Y = C + S …….. (i)
C = a + by ….. (ii)
Substitute C in (i) using equation (ii):
Y = a + by + S
Make S the subject:
S = Y – a – by
S = -a – by + Y
S = a + Y – by
S = a + Y(1 – b)
S = a + (1 – b)Y
The saving function can be illustrated as follows:
Average Propensity to Save (APS)
This refers to saving per unit income.
APS = S / Y
Marginal Propensity to Save (MPS)
Is additional saving resulting from additional income.
MPS = ΔS / ΔY
Qn: Show that MPS + MPC = 1 where MPS is marginal propensity to save and MPC is marginal propensity to consume.
Solution:
Y = C + S
Assume there is a change in income bringing a change in both consumption and savings.
Y = C + S
MPC = ΔC / ΔY and MPS = ΔS / ΔY
Divide throughout by change in income:
Y / Y = C / Y + S / Y
1 = MPC + MPS
FACTORS AFFECTING THE LEVEL OF SAVINGS
- The level of income
- Amount spent on consumption
- Rate of interest on savings
- Price of commodities
- Government expenditure
- The level of taxes
- Government policy in establishing financial institutions and educating people on savings.
MULTIPLIER
- Is a change in equilibrium of net national products resulting from a change in investment.
- Multiplier is the rate of change of national income resulting from changes in the determinant of the national income. It shows the number of times the investment has changed to reach a particular amount of national income.
- It is denoted by letter k. k multiplier is equal to change in income over change in investment.
Derivation of the Multiplier:
Suppose the equilibrium income is given by Y = C + I
Y₀ = C₀ + I₀ …….. (i)
Assuming there is any change in investment leading to a new level of equilibrium:
Y₁ = C₁ + I₁ …….. (ii)
To obtain a change in income subtract eqn (i) from (ii):
ΔY = ΔC + ΔI …….. (iii)
The change in I also being a change in C.
The change in consumption depends on MPC where:
MPC = ΔC / ΔY
ΔC = MPC × ΔY …….. (iv)
Substitute equal (iv) into (iii):
ΔY = MPC × ΔY + ΔI
Make change in I subject:
ΔI = ΔY – MPC × ΔY
= ΔY (1 – MPC)
Divide throughout by ΔI:
ΔI / ΔI = ΔY / ΔI (1 – MPC)
1 = ΔY / ΔI (1 – MPC)
Divide both sides by (1 – MPC):
K = ΔY / ΔI = 1 / (1 – MPC)
Qn 1: Given that MPC = 0.2, find the multiplier.
Solution:
K = 1 / (1 – 0.2) = 1 / 0.8 = 1.25
Qn 2: Given MPC = 0.8, find MPS.
MPC + MPS = 1
0.8 + MPS = 1
MPS = 1 – 0.8 = 0.2
Qn 3: Given ΔY to be 100 which results from an I of 20, find MPC.
K = ΔY / ΔI = 100 / 20 = 5
K = 1 / (1 – MPC)
5 = 1 / (1 – MPC)
5 (1 – MPC) = 1
5 – 5 MPC = 1
-5 MPC = 1 – 5
-5 MPC = -4
MPC = 4 / 5 = 0.8
INVESTMENT
What is investment?
Investment is the expenditure that leads to an increase in the existing stock of capital goods.
The stock of capital should be aimed at yielding a more flow of goods and services in the future.
Autonomous investment
Is an investment that does not depend on changes of income, e.g., investment in public goods and services.
Induced investment
Is an investment that occurs as a result of changes in income.
FACTORS AFFECTING THE LEVEL OF INVESTMENTS
- Level of income
- Marginal efficiencies of capital (MEC), i.e., rate of return on use of capital.
- Availability of infrastructure.
- The size of the market for goods and services produced (level of demand).
- Cost of investments. When it is high or low, it affects the level of investments positively or negatively.
- Government policy, i.e., tax on import subsidies, privatization policy, and licensing procedure.
- Rate of interest on borrowings.
Multiplier process
Is the process through which the initial change in income passes through the final stop where all of the income invested is saved, i.e., savings is equal to amount invested.
Suppose an investment of 1000 million is invested in road construction. The investment will change into income when it is received. The money will be used in buying construction material and paying the workers and laborers; they receive the money and will consume it and save part of that money. Suppose the MPC is 80%, then:
| Round of spending | Increase in Y consumption in Y | Cumulative income consumed | Savings | Cumulative saving |
|---|---|---|---|---|
| 1000 | ||||
| 1800 | 200 | 200 | ||
| 160 | 360 |
According to the table above, the receiver of the table will consume 800 million and save 200 million; the receiver of 800 will consume 80% which is 640 and save 160. The process will continue until saving is equal to investment.
The amount obtained at the end of the process can also be obtained using the multiplier formula thus:
K = ΔY / ΔI = 1 / (1 – MPC)
K = 1 / (1 – 0.8) = 1 / 0.2 = 5
ΔY / 1000
ΔY = 5000
There are other forms of multiplier which include tax multiplier, government expenditure multiplier, foreign trade multiplier, and income multiplier:
- Tax multiplier = ΔY / Δ taxes
- Government expenditure multiplier = ΔY / Δ government expenditure
- Foreign trade multiplier = ΔY / Δ net export
- Income multiplier = ΔY / Δ total income
Assumptions of multiplier
- The multiplier assumes that all income is spent on consumption.
- It assumes MPC is constant.
- It assumes there is no scarcity of goods and services such that any additional income must be spent in consumption.
- It works in a closed economy where there is no effect of imported inflation.
- It assumes that there are no leakages and injections.
Limitations of multiplier process in LDCs
- Lack of well-established capital industries; any investment established must involve the purchase of capital goods such as machines from developed countries. The importation of capital goods from abroad causes leakages (withdrawals) to the multiplier, where it assumes there are no leakages (outflow of income to abroad).
- Lack of entrepreneurial abilities in LDCs; thus, for any investment, experts must be imported from abroad, which may cause leakages to the multiplier because it involves outflow of income.
- Poor productivity due to low level of technology; hence output produced in LDCs is very low. As a result, LDCs are forced to import goods and services from abroad, which also causes leakages to the multiplier because it involves income outflow.
- Poor infrastructure in LDCs due to poor means of transport and communication; it becomes cheaper sometimes to import goods and services from abroad than to buy them within the country, resulting in leakages of the multiplier process.
- Low wages paid to workers in LDCs; in order to meet their day-to-day transactions of buying goods and services, they have to borrow money, and when they receive their income, they use it to settle the debts, hence affecting the multiplier process.
ACCELERATION PRINCIPLE
Shows the relationship between changes in investment resulting from a change in income. It is brought about as follows: after the multiplier process has taken place leading to an increase in income, this income will be invested by investors in different sectors until the amount is over. For example:
If a change in investment of 1000 brings a change in income of 5000 through the multiplier process, and the 5000 is then invested to bring a total investment at the end of 20,000, then the accelerator is 4.
Accelerator is denoted by letter V where V is equal to change in investment over change in income:
V = ΔI / ΔY
INCOME INEQUALITY
Is the difference of income among different people.
Forms of income inequality
- Individual income inequality
Is difference in income among different individuals resulting from different opportunities.
- Regional income inequality
The difference in regions depends on the availability of natural resources and their utilization.
- Income inequality among sectors
Inequalities in a sector depend on the sector income, e.g., TRA workers and teachers.
- Rural – urban inequality
CAUSES OF INDIVIDUAL INCOME INEQUALITY
- Education level
- Inheritance
- Social evils including corruption, smuggling, prostitution, black market, etc.
- Opportunities and luck
- Ownership of major means of production
- The tax system/structure, e.g., regressive tax, high income tax
- Natural abilities, i.e., talents.
ADVANTAGES OF INCOME INEQUALITY
- It brings about good relationships and respect among people in the community.
- It encourages mobility of labor.
- It leads to creativity.
- It enables different tax systems to exist, e.g., progressive tax system.
- It improves relationships between employees and employers.
- It helps in promoting government policy like poverty eradication.
DISADVANTAGES OF INCOME INEQUALITY
- It creates or leads to political and social problems/instability.
- It leads to social evils.
- It leads to exploitation of man by man.
- It discourages investment in low-income groups.
- It leads to rural–urban migration as a result of rural–urban income difference.
- It leads to decrease in consumption affecting demand.
- It leads to economic dualism, i.e., two groups of rich and poor.
MEASURES TO CONTROL INCOME INEQUALITY
- By providing subsidies to low-income groups.
- By restructuring the tax system, hence using progressive tax system.
- Providing equal opportunities to all, such as free education.
- Control of major means of resources ownership, i.e., through nationalization policy.
- Creating more employment opportunities.
- Government policies. The government should indicate policies which will be geared to reduce or eradicate income inequality, e.g., family planning.
METHODS OF SHOWING INCOME INEQUALITY
The Lorenz curve
Meaning: It is a locus of points that shows cumulative percentage population and cumulative percentage income.
It is used to show how even or uneven the income distribution is.
In interpreting the data from Lorenz curve, the following are important:
- The further the curve from the line of perfect equality, the poorer the distribution of income.
- The closer the curve to the line of perfect equality, the better the income distribution (the more equal the income is distributed).
- In drawing a Lorenz curve, the data is grouped into groups of fifths or percentages.
- Cumulative data is used in drawing.
| Population | Income % | Cumulative population % | Cumulative income % |
|---|---|---|---|
| 1st fifth | 4 | 20 | 4 |
| 2nd fifth | 7 | 40 | 11 |
| 3rd fifth | 12 | 60 | 23 |
| 4th fifth | 30 | 80 | 53 |
| 5th fifth | 47 | 100 | 100 |
LORENZ CURVE
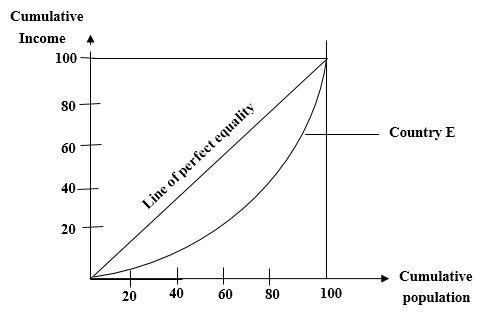
Interpretation
- The 5th fifth or upper fifth own 11 times the wealth/income more than the lower fifth, i.e., 47 / 4 = 11.75.
- The upper fifth own 6 times more than the 2nd fifth, i.e., 47 / 7 = 6.7.
- The upper fifth own 1.6 times more than the 4th fifth, i.e., 47 / 30 = 1.6.
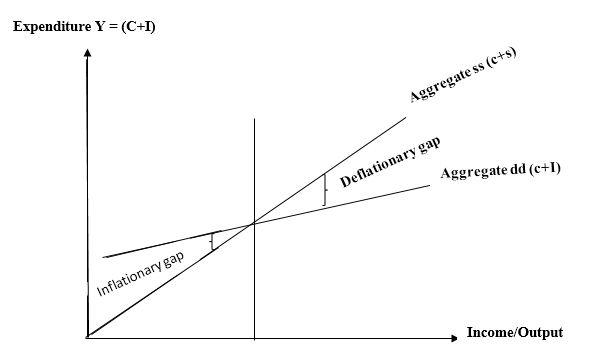
THE CONCEPT OF FULL EMPLOYMENT, INFLATIONARY GAP AND DEFLATIONARY GAP
FULL EMPLOYMENT
Is a situation where all persons who are willing and able to work are employed. During full employment, the resources are fully utilized and national income is at maximum.
INFLATIONARY GAP
This is a situation where aggregate supply (consumption + saving) = C + S is less than aggregate demand (consumption + investment), i.e., C + S < C + I, hence S < I.
DEFLATIONARY GAP
This is a situation where aggregate expenditure is less than aggregate supply. The gap shows the amount by which the expenditure should be increased to attain full employment.
PER CAPITA INCOME
Qn 1: What is per capita income?
It is the income of an individual out of the national income.
PER CAPITA INCOME = NATIONAL INCOME / TOTAL POPULATION
Per capita income is not a good indicator of the standard of living (welfare) of the people in a given country due to the following reasons:
- The size of per capita income depends on the size of national income.
National income value includes all expenditure even those which do not reflect welfare like buying weapons, etc., which do not improve the standard of living.
- The value of national income depends on the price of commodities. Higher prices lead to higher national income, higher capital, hence low standard of living.
- Per capita income depends on the size of population. The lower the population, the higher the per capita income; this might not be true for better living standards.
- National income and per capita income might be higher because of incorrect data.
- National income does not take into account the social cost in the process of production such as pollution, health hazards, etc., which also affects the welfare of people.
- Different countries have different exchange rates making it difficult to compare per capita income and standard of living.


1 Comment