


Graphical Methods Questions
1. The equation of a circle is given as
2x2 + 2y2 – 8x + 5y + 10 = 0. Find the radius of the circle and the coordinates of its centre. (3 mks)
2. The equation of a circle is given by x2 + 4x + y2 – 5 = 0. Find the centre of the circle and its
radius.
3. The equation of a circle is x2 + y2 + 6x – 10y – 2 = 0. Determine the co-ordinates of the
centre of the circle and state its radius
4. In the diagram below ABE is a tangent to a circle at B and DCE is a straight line.
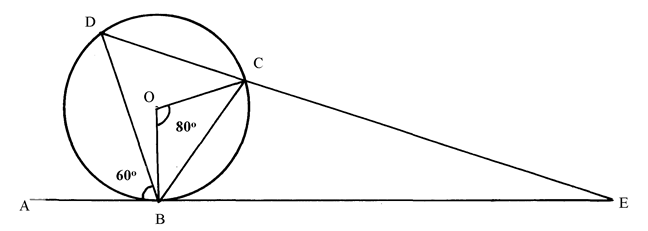 If ABD = 60o, BOC = 80o and O is the centre of the circle, find with reasons BEC
5. Obtain the centre and the radius of the circle represented by the equation:
x2 + y2 – 10y + 16 = 0
6. Complete the table below, for the function y = x3 + 6x2 + 8x
x | -5 | -4 | -3 | -2 | -1 | 0 | 1 |
x3 | -125 | -27 | -8 | 0 | 1 | ||
6x2 | 96 | 54 | 6 | 0 | 6 | ||
8x | -40 | -24 | 0 | 8 | |||
y | 3 | 0 | 0 | 15 |
(a) Draw a graph of the function y = x3 + 6x2 + 8x for – 5 x 1 and use the graph to estimate
the roots of the equation x3 + 6x2 + 8x = 0
(b) Find which values of x satisfy the inequality x3 + 6x2 + 8x -1 > 0
7. Sketch the curve of the function y = x3– 3x + 2 showing clearly minimum and maximum points
and the y – intercept.
8. Show that 4y2 + 4x2 = 12x – 12y + 7 is the equation of a circle, hence find the co-ordinates
of the centre and the radius
9. Two variables R and P are connected by a function R = KPn where K and n are constants.
The table below shows data involving the two variables
P | 3 | 3.5 | 4 | 4.5 | 5 |
R | 36 | 49 | 64 | 81 | 100 |
(a) Express R = KPn
in a linear form
(b) Draw a line graph to represent the information above
(c) Find the values of constants K and n
(d) Write down the law connecting R and P
(e) Find the value of P when R = 900
10. A circle of radius 3cm has the centre at (-2, 3) . Find the equation of the circle in the
form of x2 + y2 + Px + qy + c = 0
11. In an experiment, the values of two quantities V and T were observed and the results recorded as
shown below.
V | 0 | 2 | 4 | 6 | 8 | 10 |
T | 0.49 | 0.30 | 0.24 | 0.20 | 0.16 | 0.137 |

It is known that T and V are related by a law of the form a
b + V
where a and b are constants.
a) Draw the graph of I against V
T
b) Use your graph to find;
i) The values of a and b.
ii) V when T = 0.38
iii) T when V = 4.5
12. Find the equation of the tangent to the curve y = 2x3 + x2 + 3x – 1 at the point (1, -5)
expressing you answer in the form y = mx + c
13. Given that :- 243 = (81)-1 x ( 1/27) x determine the value of x
14. Show that 3x2 + 3y
2 + 6x – 12y – 12 = 0 is an equation of a circle hence state the radius and
centre of the circle
15. (a) Fill in the table below for the function y = -6 + x + 4x2 + x3 for -4
x
2
x | -4 | -3 | -2 | -1 | 0 | 1 | 2 |
-6 | -6 | -6 | -6 | -6 | -6 | -6 | -6 |
x | -4 | -3 | -2 | -1 | 0 | 1 | 2 |
4x2 | 16 | 4 | |||||
x3 | |||||||
y |
(b) Using the grid provided draw the graph for y = -6 + x + 4x2 + x3 for -4 x 2
(c) (i) Use the graph to solve the equations:-
(i) x3 + 4x2 + x – 4 = 0
(ii) -6 + x + 4x2 + x3 = 0
(iii) -2 + 4x2 + x3 = 0
16. The table below shows the results obtained from an experiment to determine the relationship
between the length of a given side of a plane figure and its perimeter
Length of side (cm) | 1 | 2 | 3 | 4 | 5 |
Perimeter P(cm) | 6.28 | 12.57 | 18.86 | 21.14 | 31.43 |
(a) On the grid provided, draw a graph of perimeter P, against
(b) Using your graph determine;
(i) the perimeter of a similar figure of side 2.5cm
(ii) the length of a similar figure whose perimeter is 9.43cm
(iii) the law connecting perimeter p and the length
(c) If the law is of the form P = 2k + c where k and c are constants, find the value of k
17. In an experiment with tungsten filament lamp, the reading below of voltage (V) current (I),
power (P) and resistance (R)were obtained. It was established that P was related to R by
a law P = a Rn – 0.6. Where a and n are constants.
V | 1.30 | 2.00 | 2.80 | 4.40 | 5.70 |
I | 1.50 | 1.80 | 2.10 | 2.50 | 2.90 |
P | 0.73 | 2.05 | 3.28 | 7.44 | 10.62 |
R | 0.89 | 1.13 | 1.33 | 1.78 | 1.99 |
Plot a suitable line graph and hence use it to determine the value of a and n
18. Find the gradient of a line joining the centre of a circle whose equation is x2 + y2 – 6x = 3 – 4y
and a point P(6,7) outside the circle..
19. a) Complete the table below for the function y = -x3 + 2x2 – 4x + 2.
x | -3 | -2 | -1 | 0 | 1 | 2 | 3 | 4 |
-x3 | 27 | 8 | 0 | -8 | ||||
2x2 | 18 | 8 | 2 | 0 | ||||
-4x | 8 | 0 | -16 | |||||
2 | 2 | 2 | 2 | 2 | 2 | 2 | 2 | 2 |
y | 26 | 2 | -6 | -46 |
b) On the grid provided below draw the graph of -x3 + 2x2 – 4x + 2 for – 3 ≤ x ≤ 4.
c) Use the graph to solve the equation -x3 + 2x2 – 4x + 2
= 0.
d) By drawing a suitable line on the graph solve the equation. –x3 + 2x2 – 5x + 3 = 0.
20. Determine the turning point of the curve y = 4x3 – 12x + 1. State whether the turning
point is a maximum or a minimum point.
21. (a) Complete the table below for the equation of the curve given by y = 2x3 – 3x2 + 1
X | -2 | -1.5 | -1 | -0.5 | 0 | 0.5 | 1 | 1.5 | 2 | 2.5 | 3 |
2x3 | -16 | -2 | 0 | 2 | 16 | ||||||
-3x2 | -12 | 0.75 | 0 | -0.75 | -27 | ||||||
1 | 1 | 1 | |||||||||
y | -27 | -12.5 | 1 | 13.5 |
(b) Use the table to draw the graph of the function y = 2x3 – 3x2 + 1
c) Use your graph to find the values of x for :-
(i) y > 0
(ii) The roots of the equation 2x3 – 3x2 + 1 = 0
(iii) 2x3 – 3x2 = 9
22. Find the radius and the centre of a circle whose equation is :
2x2 + 2y2 – 6x + 10y + 9 = 0
Graphical methods Answers
1. x2 + 4x + y2 = 5
x2 + 4x + ( ½ x 4)2 + y2 = 5 + (½ x 4)2
(x + 2)2 + (y + 0)2 = 5 + 4
(x + 2)2 + (y + 0)2 = 9
Centre (-2,0)
Radius 9
r = 3 units
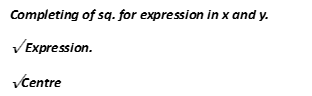 2. x2 + 6x + (3)2 + y2 – 10y + (–5) = 2 + 9 + 25
(x + 3)2 + (y – 5)2 = 36
(x – –3)2 + (y – +5)2 = 62
∴ centre (-3, 5)
Radius 6 units
3. CBE = 400 ( alt.segiment theoren)
BCE = 1200 (Suppl. To BCD = 600alt. seg.)
(40 + 120 + E) = 1800 (Angle sum of )
BEC = 200
4. X2 +Y2 – 10Y + 25 = 25 – 16
(X -0)2 + (Y – 5)2 = 9
(X – 0)2 + (Y – 5)2 = 32
Centre (0, 5)
Radius = 3
5.
x | -5 | -4 | -3 | -2 | -1 | 0 | 1 |
x3 | -125 | -64 | -27 | -8 | -1 | 0 | 1 |
6x2 | 150 | 96 | 54 | 24 | 6 | 0 | 6 |
8x | -40 | -32 | -24 | -16 | -8 | 0 | 8 |
y | -15 | 0 | 3 | 0 | -3 | 0 | 15 |
x3 + 6x2 + 8x >1
Between
(i) x = -3.85 0.1 and x -2.15 0.1
(ii) x > 0.5 0.1
6. y = x3 – 3x + 2
x = 0, y = 2
(0, 2) ⇒ y – intercept.
dy = 3x2 – 3 = 0
dx x2 = 1
x = ∓ 1
x = 1 y = 0
Point (1, 0) min point
x = -1, y= 4
Point (-1, 4) max point.

7. 4x2 – 12x + 4y2 + 12y = 7
x2 – 3x + y2 + 3y = 7/4
x2 – 3x + (3/2)2 + y2 + 3y + (3/2)2 = 7/4 + 9/4 + 9/4 = 25/4
(x – 3/2)2 + (y + 3/2)2 = 25/4
Centre (1,5, -1.5) Radius 2.5units
8. Log R =nlog p + log K
Log P | 0.48 | 0.54 | 0.60 | 0.65 | 0.70 |
Log R | 1.56 | 1.69 | 1.81 | 1.91 | 2.00 |
Gradient = 2 – 0.6
0.7
= 1.4 = 2
0.7
Log R intercepts = 0.6 = logk
K= 4
The law connecting R and P is R=4P2
900 = 4P2
P2 = 900
4
225 = P2
9. (x +2)2 (y-3)2 = 32
X2 + 4x + 4 + y2 – 6y + 9 = 32
X2 + y2 + 4x – 6y + 4 = 0
10.
V | 0 | 2 | 4 | 6 | 8 | 10 |
1 T | 2.04 | 3.33 | 4.17 | 5 | 6.25 | 7.30 |
T = a
b + V
I = b + V
T a
I = 1V + b
T a a
y = mx + C
b) (i) 1 = Grad ⇒ ∆y = 7.3 – 5 = 2.3 = 0.575
a ∆x 10 – 6 4
a = 1.739
b = y – Intercept ⇒2.04
a
b = 2.04 b = 2.04 x 1.739
1.739 = 3.547556
b ≃ 3.548
(ii) T = 0.38
I = 2.63 shown on graph
T
V = 1
-1
(iii) I = 4.45
T
T = (4.45)
= 0.2247
≃0.22
11. y = 2x3 + x2 + 3x -1
dy = 6x2 + 2x + 3
dx
gradeindent at (1, -5)
= 6 + 2 + 3= 11
y-(–5) = 11
x -1
y + 5 =11x -11
y = 11x -16
12. 35 = 3-4 x 3-x
35 = 3-4-x
-4 –x = 5
-x = 9
x =-9
13. x2 + 2x + 1 + y2 – 4y + 4 = 4 + 1 + 1
(x+1)2 + (y-2)2 = 9
Centre (-1, 2)
Radius 3units
14. c)
X | -4 | -3 | -2 | -1 | 0 | 1 | 2 |
-6 | -6 | -6 | -6 | -6 | -6 | -6 | -6 |
X | -4 | -3 | -2 | -1 | 0 | 1 | 2 |
4x2 | 64 | 36 | 16 | 4 | 0 | 4 | 16 |
X3 | -64 | -27 | -8 | -1 | 0 | 1 | 8 |
Y=-6+x+4x2+x2 | -10 | 0 | 0 | -4 | -6 | 0 | 20 |

y = x3 + 4x2 + x -6
0 = x3 + 4x2 + x -4
y = -2
(iii) y = x3 + 4x2 + x – 6
0 = x3 + 4x2 + 0 – 2
y = x – 4
x 1 0 -2
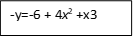 y -3 -4 -8
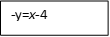
c (i) solution 0.8
-1.5
And -3.2
(c) 1, -2, -3

 15.
15.





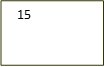




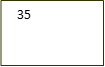
(i) P = 15.75cm
(ii) l=1.5cm
(iii) m = 35- 25 = 10 = 6.667
5.5 – 4.0 1.5
(c) choose P(5,31.4)
p – 31.4 = 10
l -5 1.5
p-31.4 = 100
l-5 1.5
15p – 471 = 100k – 500
15p = 100l – 29
15 15
2k = 100
15
k= 100 = 3.33
2 x 15
c =1.93
P + 0.6 = arh
Log (P + 0.6) = log a + n log R
= n log R + log 9
P + 0.6 | 1.33 | 2.65 | 3.85 | 8.04 | 11.22 |
Log (P + 0.6) | -0.13 | 0.42 | 0.59 | 0.91 | 1.05 |
Log R | -0.05 | 0.05 | 0.12 | 0.25 | 0.30 |

Log 0.3 = ¼ = 0.25
Log a = 0.3
17. x2 + y2 – 6x = 3 – 4y
x2 – 6x + (-6/2)2 + y2 + 4y + (4/2)2 = 3 + (-6/2)2 + (4/2)2
(x – 3)2 (y + 2)2 = 3 + 9 = 4
(x – 3)2 (y + 2)2 = 16
C (3, -2)
Gradient ∆y = 7 – -2 = 3
∆x 6 – 3
x | -3 | -2 | -1 | 0 | 1 | 2 | 3 | 4 |
-x3 | 27 | 8 | 1 | 0 | -1 | -8 | -27 | -64 |
2x2 | 18 | 8 | 2 | 0 | 2 | 8 | 18 | 32 |
-4x | 12 | 8 | 4 | 0 | -4 | -8 | -12 | -16 |
2 | 2 | 2 | 2 | 2 | 2 | 2 | 2 | 2 |
y | 59 | 26 | 9 | 2 | -1 | -6 | -19 | -46 |
b) Check on the graph paper.
c) x = 0.5 + 0.1
d) –x3 + 2x2 – 5x + 3 = 0
Line to allow: y = x – 1
x 0 1
y -1 0
x = 0.65
19. Dy/dx = 12x2 – 12
12x2 – 12 = 0
12(x2 – 1) =0
x = 1
x = -1
At x = 1 At x = -1
0 | 1 | 2 | -2 | -1 | 0 |
GRD = 12 | 0 | 36 | 36 | 0 | -12 |
– 0 + + 0 –
(1,7) (-1, 9)
Minimum maximum
20. (a) table
(b) plotting
scale
smooth curve
(c) (i) -0.5 < x < 1 and x>1
(iii) x = 2.5 0.1
21. 2x2 + 2y2 – 6x + 10y + 9 = 0
x2 + y2 – 3x + 5y + 9/2 = 0
x2 + y2 – 3x + 5y = -9/2
x2 – 3x + 9 + y2 + 5y + 25 = 8.5 – 4.5
4 4
(x – 3)2 + (y + 5)2 = 4
2 2
Radius = 2 units
Centre = (1.5, -2.5)


